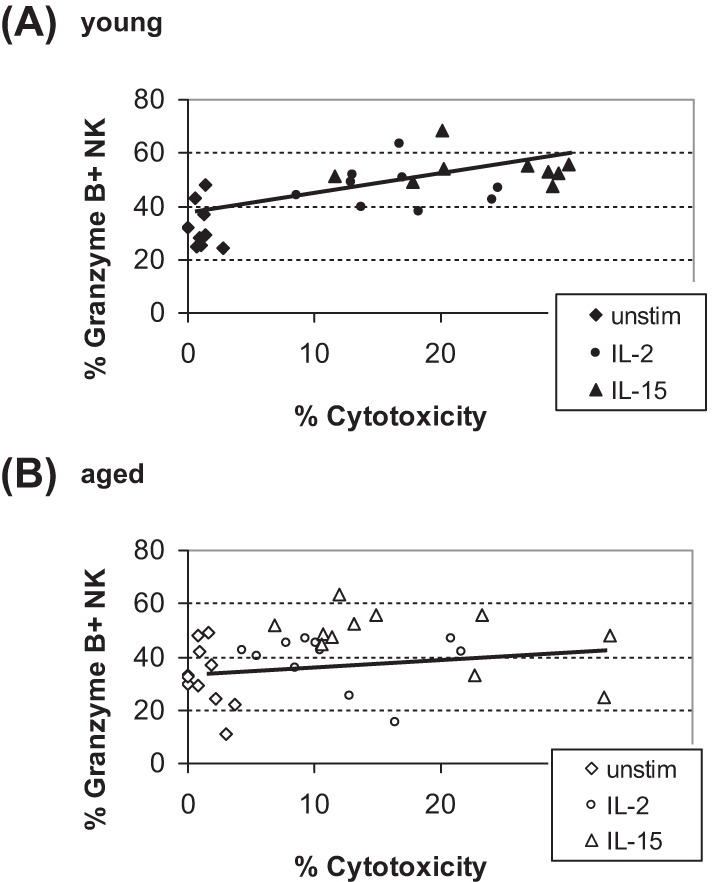
Figure 4.

Correlation between NK cell cytotoxicity and NK cells expressing Granzyme B. Data from cytotoxicity and granzyme B expressing NK (CD8−/NK1.1+) cells in (A) young and (B) aged mice were examined. Enhancement in NK cytotoxicity was significantly correlated with percent granzyme B expression in young (r = .69, r2 = .48, p < .001), but not in aged (r = .18, r2 = .03, p > .1), by Pearson’s correlation analyses. Diamond represents unstimulated, circle IL-2, and triangle IL-15. Total n = 9 (young) or 12 (aged) in each treatment, with each point representing an individual mouse.
