Figure 3.
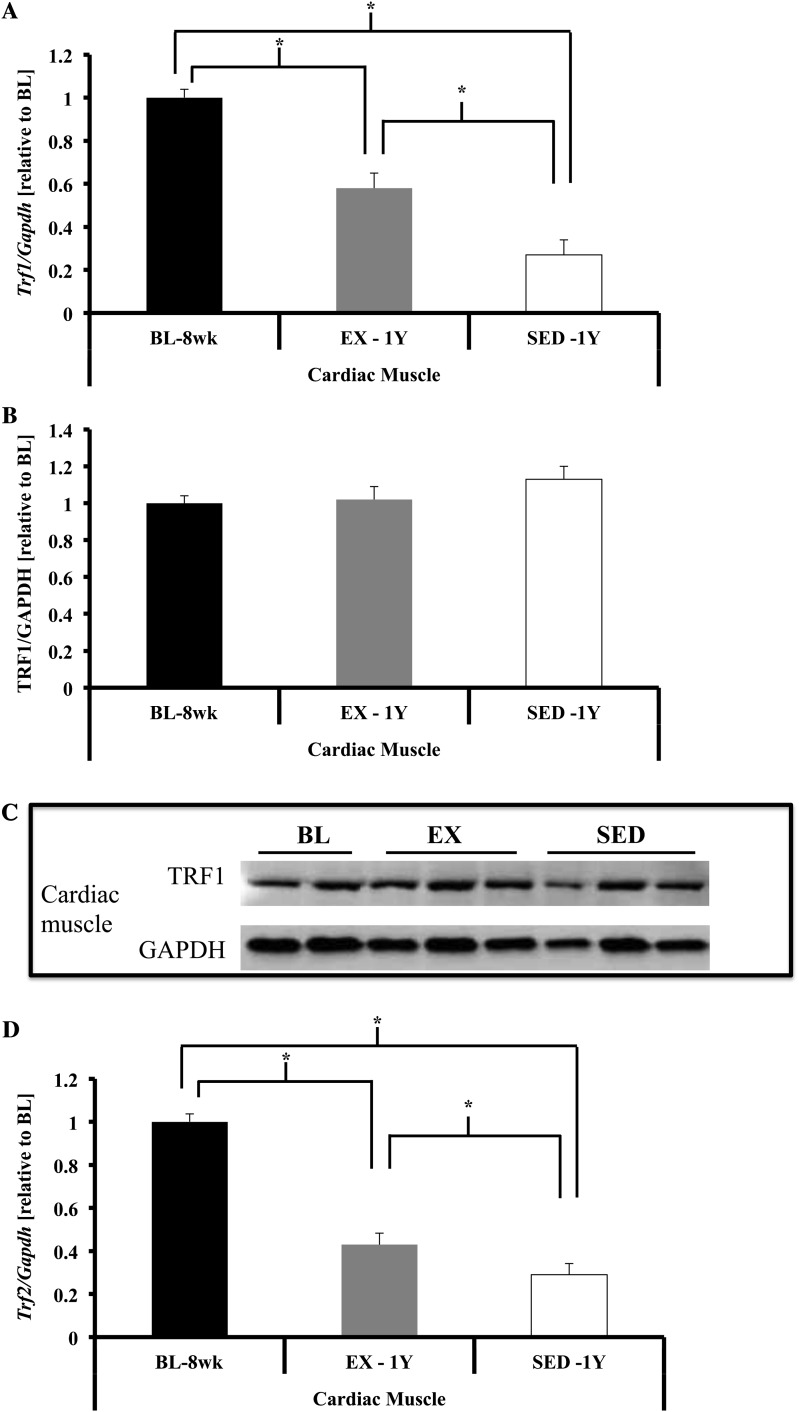
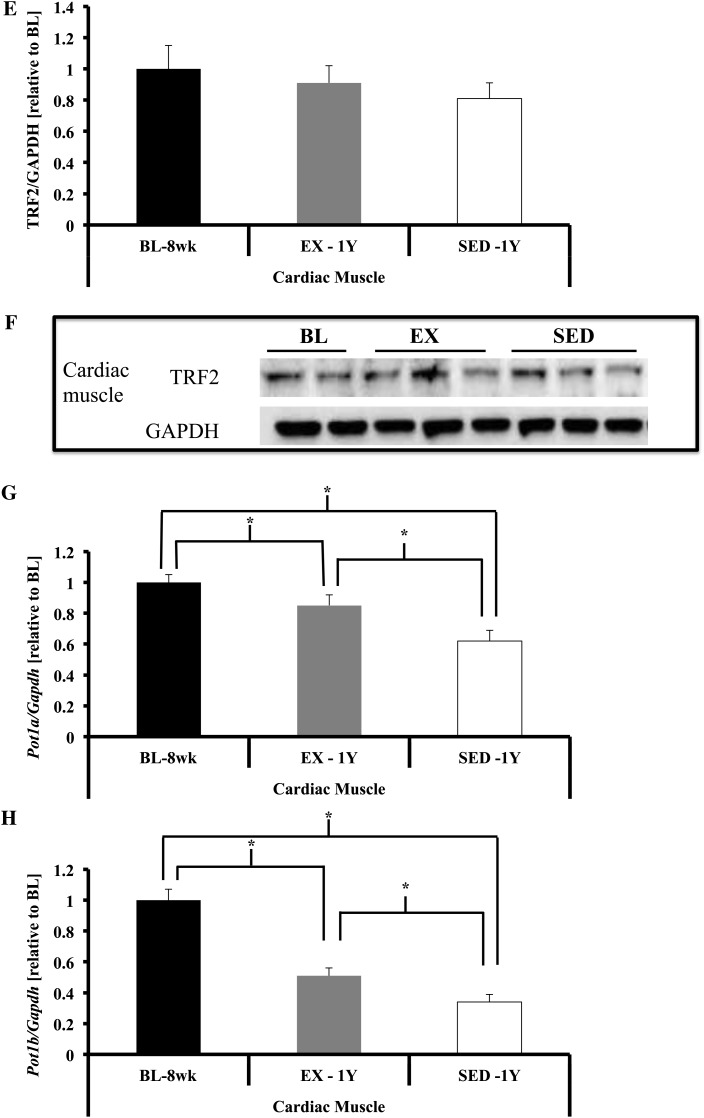
Shelterin component gene expression in cardiac tissue. (A) Trf1 gene expression was significantly lower in cardiac muscle of SED-1y compared with both BL-8wk and EX-1y (both p < .01), whereas EX-1y was lower compared with BL-8wk (p < .01). (B and C) No differences were observed for TRF1 protein between groups. (D) Trf2 gene expression was significantly lower in SED-1y compared with both BL-8wk and EX-1y (both p < .01), and BL-8wk was greater than EX-1y (p < .01). (E and F) TRF2 protein content was not different between any groups. (G) Pot1a gene expression was significantly lower in SED-1y compared with both BL-8wk and EX-1y (both p < .01), and BL-8wk tended to be greater than EX-1y (p = .06). (H) Pot1b gene expression was significantly lower in SED-1y compared with both BL-8wk and EX-1y (p < .01 and p = .02, respectively), and BL-8wk was greater than EX-1y (p < .01). Messenger RNA abundance was assessed by reverse transcription–polymerase chain reaction, and target genes were normalized to Gapdh (A, D, G, H, and I). GAPDH was used as a loading reference for protein content (B, C, E, and F). Results of densitometric analysis and representative immunoblot images are shown. *Indicate significantly different at p < .05. **Indicate significantly different at p < .01. BL-8wk = baseline 8 weeks of age; EX = exercise; SED = sedentary; 1y = 1 year of age.


