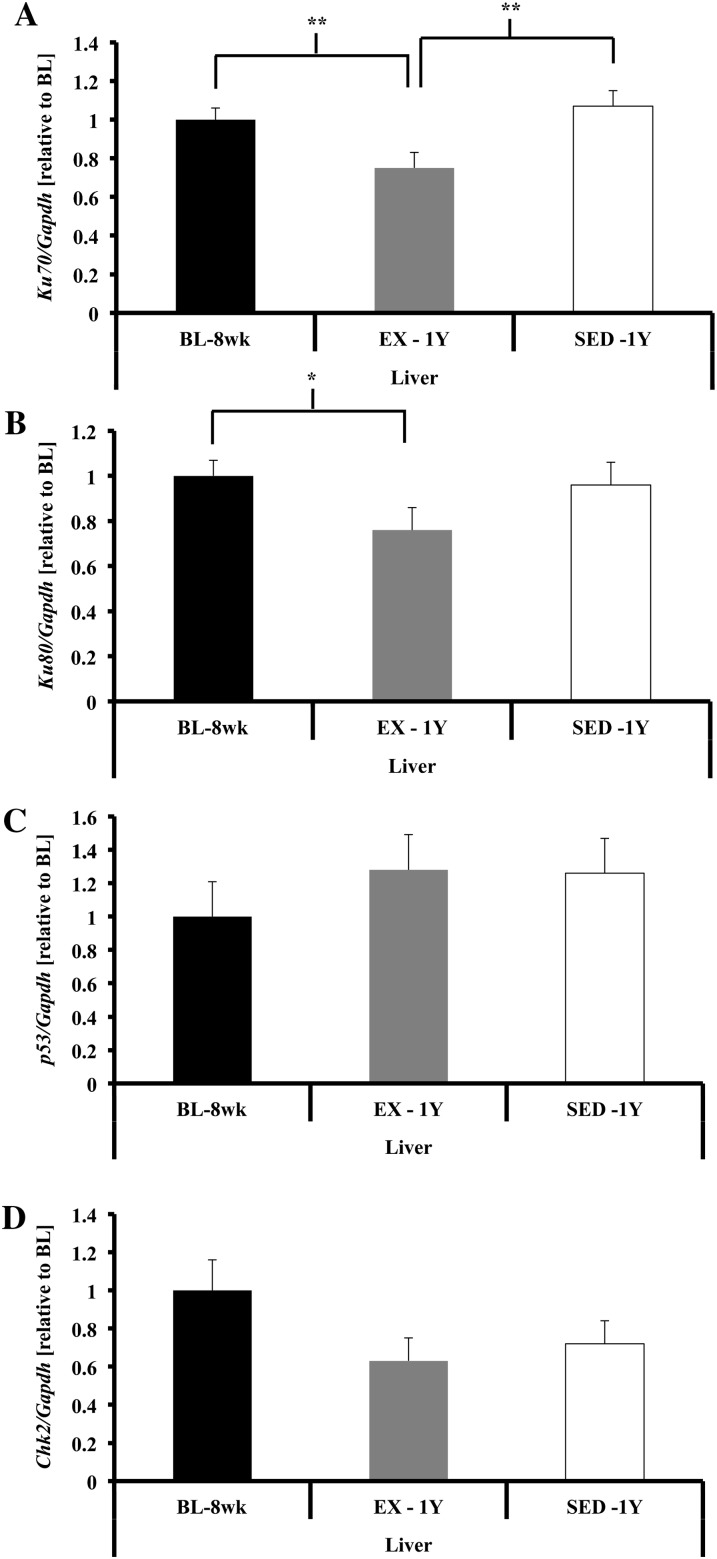
Figure 7.
DNA damage repair and response in liver tissue. (A) Ku70 gene expression was higher in liver of SED-1y compared with EX-1y but was similar to BL-8wk (p < .01). BL-8wk had greater gene expression compared with EX-1y (p = .01). (B) Ku80 gene expression was higher in liver of BL-8wk and tended to be higher in SED-1y compared with EX-1y animals (p = .03 and p = .07, respectively). SED-1y and BL-8wk were similar. (C) p53 gene expression was not different in liver tissue. (D) Chk2 gene expression was not different in liver tissue. Messenger RNA abundance was assessed by reverse transcription–polymerase chain reaction, and target genes were normalized to Gapdh. Results of densitometric analysis are shown. *Indicate significantly different at p < .05. **Indicate significantly different at p < .01. BL-8wk = baseline 8 weeks of age; EX = exercise; SED = sedentary; 1y = 1 year of age.

