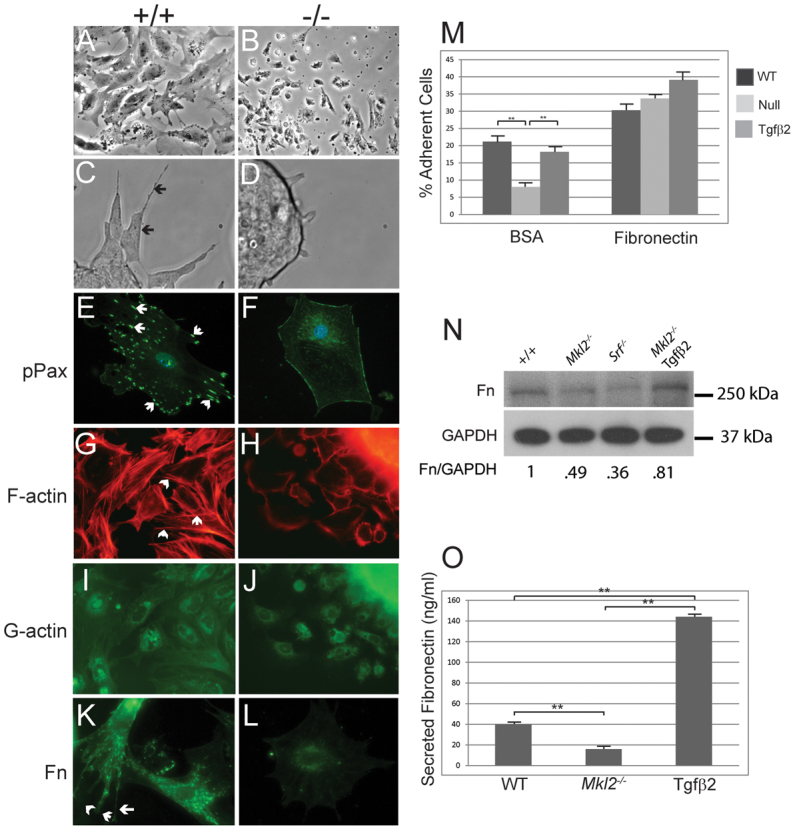
Fig. 6.

Mkl2–/– ES cells exhibit derangements in cytoskeletal organization and cell adhesion that are rescued by TGFβ2. (A-D) Phase-contrast micrographs showing wild-type (A,C) and Mkl2–/– (B,D) ES cells 24 hours after plating on fibronectin-coated chamber slides. Wild-type ES cells spread and form numerous protrusive lamellpodia and filopodia (arrows) (C). Original magnifications were ×20 (A,B) and ×200 (C,D). (E-L) Immunostaining of wild-type and Mkl2–/– ES cells for expression of proteins associated with cell adhesion and cytoskeletal organization. (E,F) Wild-type and Mkl2–/– ES cells immunostained with anti-phospho-paxillin (green) and counterstained with DAPI (blue), demonstrating abundant expression in complexes across wild-type ES cells and low level expression at margins of Mkl2–/– ES cell. Arrows indicate focal adhesions. (G,H) Staining with rhodamine-phalloidin, which localizes to F-actin (red), demonstrates a rich array of actin filaments in control ES cells and absence of stress fibers in Mkl2–/– ES cells. Arrows indicate actin filaments. (I,J) ES cells were exposed to DNase I to identify monomeric G-actin (green). (K,L) ES cells immunostained with anti-fibronectin antibody demonstrate abundant expression in wild-type ES cells with localization to lamellopodia and filopodia (K, white arrows). By contrast, relatively low levels of fibronectin are observed in the perinuclear regions of Mkl2–/– ES cells (L). Original magnification ×400. (M) A fluorometric cell adhesion assay was performed comparing the capacity of wild-type (WT) ES cells (black bars), Mkl2–/– null ES cells (light-gray bars) and Mkl2–/– null ES cells stably transfected with an expression plasmid encoding TGFβ2 (gray bars) to adhere to BSA- or fibronectin-coated tissue culture plates. Data are expressed as % adherent cells±s.e.m. (**P<0.01). (N) Immunoblot analysis of fibronectin (Fn) expression in cell lysates prepared from wild-type (+/+) Mkl2–/–, Srf–/– and Mkl2–/– + TGFβ2 ES cells, respectively. The fibronectin signal was normalized to expression of GAPDH (bottom panel). Data are expressed as normalized Fn expression compared with Fn expression in wild-type ES cells. MW standards are shown on the right of the blot. (O) An ELISA assay was employed to quantify secreted fibronectin in medium harvested from wild-type, Mkl2–/– and Mkl2–/– + TGFβ2 ES cells after 1 hour of incubation. Data are expressed as mean secreted fibronectin (ng/ml)±s.e.m. **P<0.001.
