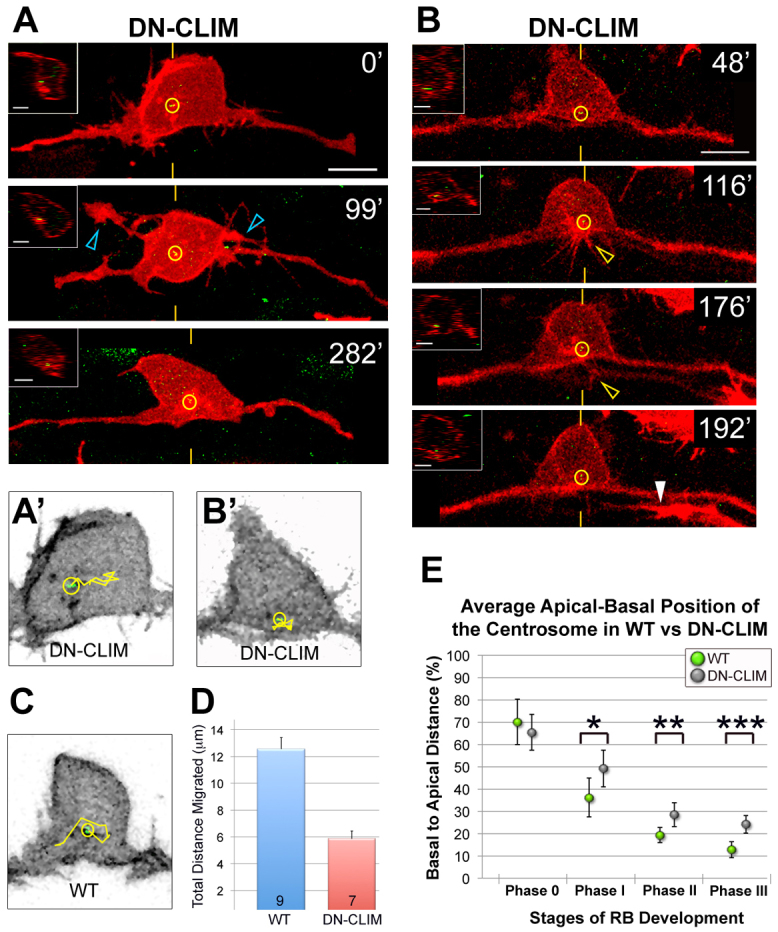
Fig. 5.

Disruption of LIM-HD transcription factor activity affects centrosome motility and positioning in RB neurons. (A,B) Individual RB neurons labeled by transient expression of TagRFP-CAAX in GFP-Xcentrin mRNA- and DN-CLIM mRNA-expressing zebrafish embryos. Dorsal-lateral views, anterior left. Images are z-projections of RB neuron (red) overlaid with single xy planes of the centrosome (green). Insets are optical cross-sections (medial is left) through the centrosome region (indicated with yellow hatch marks). (A) Time-lapse images show a relatively apical centrosome position (yellow circles) (compare with wild type, Fig. 3) during ectopic apical neurite formation (blue open arrowheads). (B) Time-lapse images show a normal basal but relatively medial centrosome localization (compare with wild type, Fig. 3) in a neuron that initiates then retracts a peripheral neurite (yellow open arrowhead). White arrowhead indicates a neighboring central axon entering the field. Scale bars: 10 μm; 5 μm in insets. (A′,B′,C) Tracks (yellow lines) of centrosome movement in neurons shown in A and B (DN-CLIM) and in Fig. 3C (wild type, WT). (D) Quantification of average total distance of centrosome migration during a 2-hour period. Error bars represent s.e.m. The number of neurons (n) is indicated in each bar. P<10–4, two-tailed t-test. (E) The average centrosome position and its distribution about the mean (± 2 s.e.m.) during developmental stages. For comparison, wild-type data (Fig. 2B) are included. For DN-CLIM, mean percentages are: phase 0, 65.4±8.0% (n=14); phase I, 49.2±8.3% (n=10); phase II, 28.5±5.5% (n=20); phase III, 24.1±3.9% (n=15). A total of 42 neurons were analyzed in live embryos. *P=0.0481, **P=0.0180, ***P=0.0004, two-tailed t-test.
