
Fig. 6.
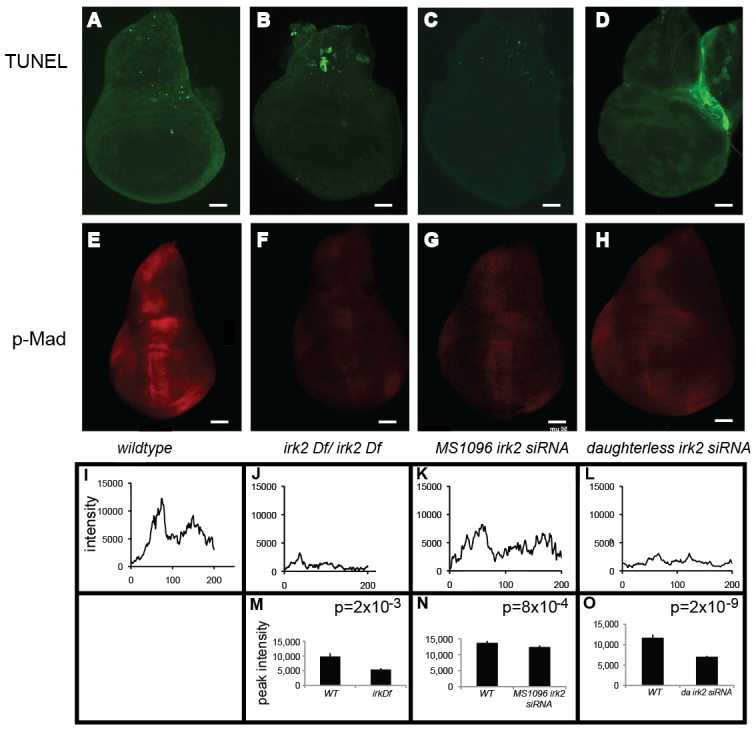
Reduced Mad phosphorylation in Irk2DfA/Irk2DfB and Irk2 siRNA wing discs. (A-D) TUNEL-stained wing discs. Anterior is rightwards. (E-H) Anti-p-Mad stained wing discs. (I-L) Relative fluorescence intensity across a posterior to anterior cross-section of the anti-p-Mad-stained wing disc shown in E-H. (M-O) Graphs of average peak intensity of control and irk2DfA/irk2DfB (M), control and MS1096-GAL4 irk2 siRNA (N), and control and daughterless-GAL4 Irk2 siRNA (O). Control and experimental discs were stained and imaged in parallel. Graphs represent average peak intensities for n>7 anti-p-Mad-stained discs. Peak intensity is determined by subtracting minimum from maximum fluorescence intensity in a posterior to anterior cross-section of the anti-p-Mad stained wing disc. Data are mean±s.e.m. Scale bars: 50 μm.