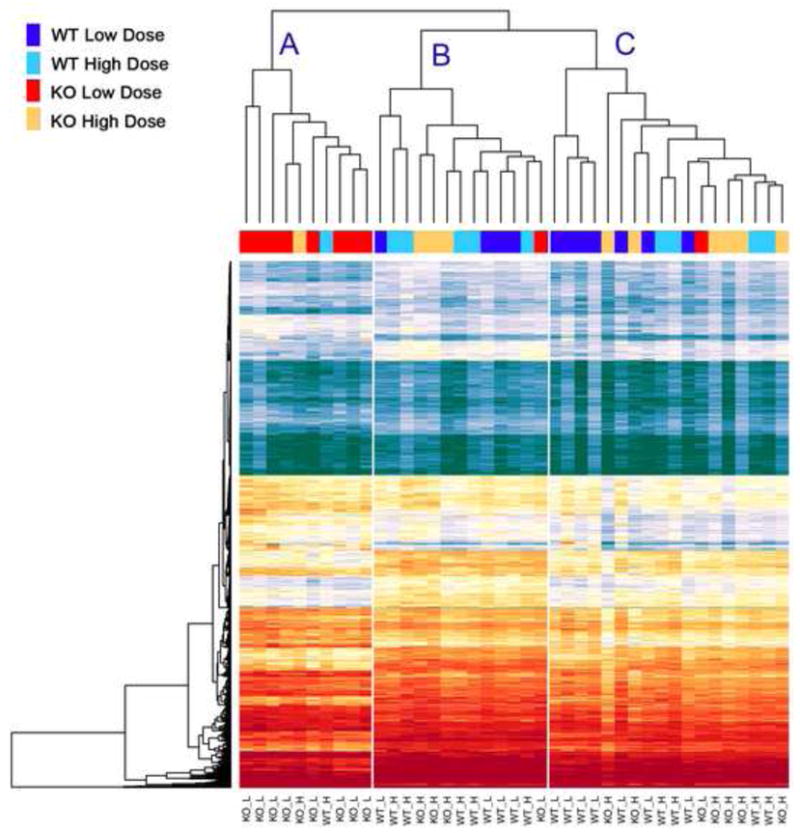
Figure 1. Synaptic gene expression levels in Sod2 −/− animals and wild-type mice reveal expression changes related to the level of oxidative stress.

Heatmap of significant changes in genome expression changes reveal that the expression changes in the mice are most apparent in the animals that are treated with a low dose of EUK-189 synthetic antioxidant. Gene expression upregulation is colored in red/yellow, while downregulated genes are shown in blue/green. Using hierarchical clustering of each animal based upon these changes results in 8 of 10 low dose Sod2 −/− mice (KO_L, Red) to cluster into branch A. This expression of the transcriptome shifts to a pattern more akin to wild-type animals (WT_L and WT_H, Light Blue and Dark Blue) with the administration of a high dose of EUK-189 in the Sod2 −/− mice (KO_H, Yellow) and clusters among them in branches B and C.
