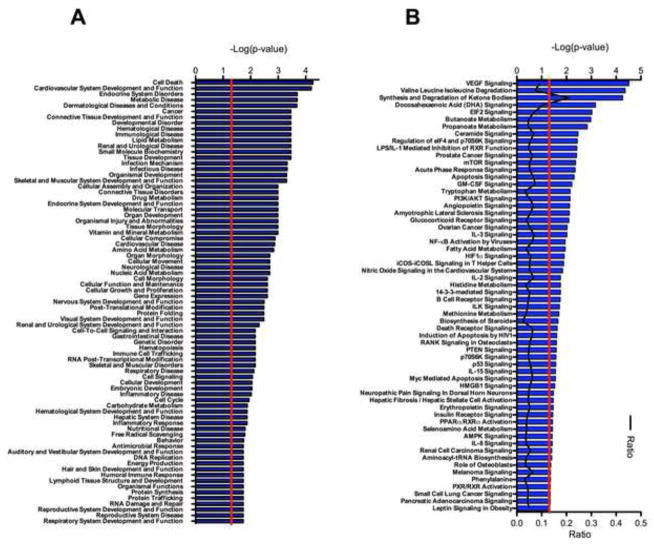
Figure 2. Analysis of Sod2 −/− and wild-type animals which are treated with a high dose of EUK-189 (30 mg/kg) antioxidant compound.
Pathway analysis for animals receiving High dosage (30 mg/kg) of the antioxidant treatment. (A) Gene function analysis of the most significant gene functions where the red line indicates the significance cut off of -log(0.05) for the fisher’s exact t-test. (B) Analysis of the top signaling and metabolic pathways which are associated with the differential expression in the Sod2 −/− animals. The red line again indicates the significance cut off of p < 0.05 for the fisher’s exact test. The black line indicates the ratio of signal values for the wild-type to the Sod2 −/− knockout animals which is represented on the lower axis.

