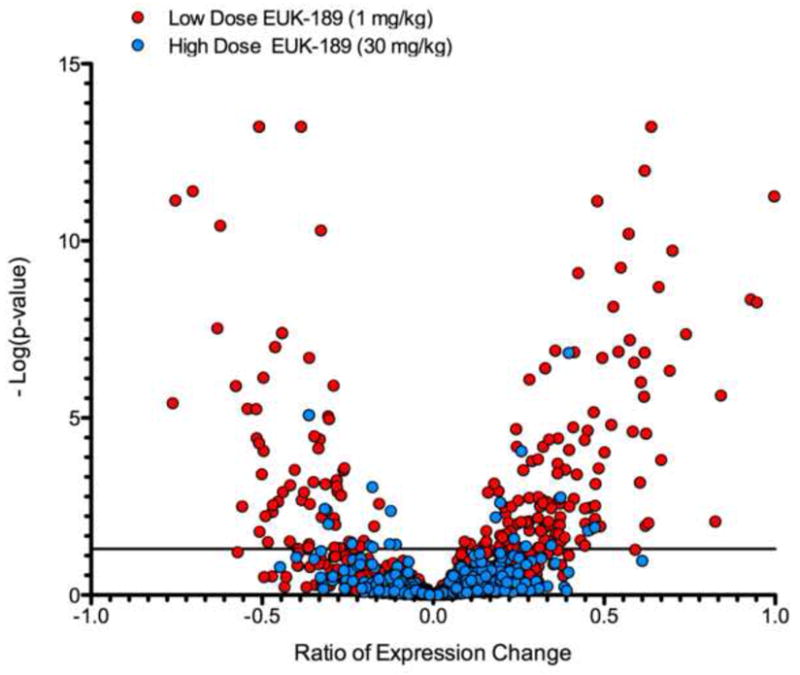
Figure 6. Analysis of gene expression of proteins localized to the synapse.

This volcano plot displays the gene expression data of the LC-MS identified proteins in the low dose treated Sod2 −/− as compared to their wild-type controls are shifted in their expression levels in both their magnitude and significance of change. The significance cutoff (p < 0.05) is represented by the horizontal line; points above this line are significantly changed as compared to their respective wild-type controls. Treatment of the Sod2 −/− animals with a higher dose of EUK-189 effectively normalizes the expression of most but not all proteins at the synapse
