FIGURE 1.
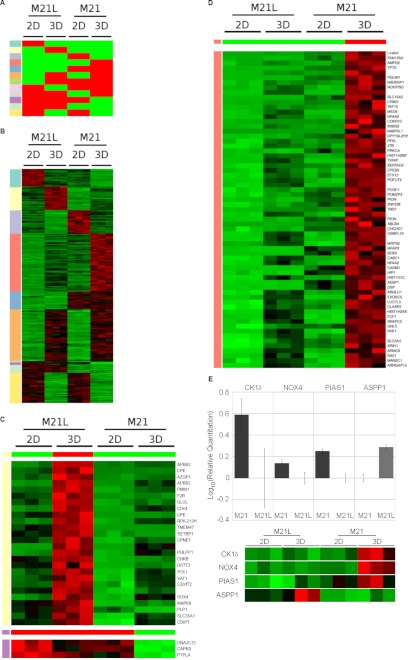
Microarray analysis of M21 (αv+) and M21L (αv−) cells grown in two- (2D) and three-dimensional (3D) collagen tissue culture identified a number of patterns of gene up- and down-regulation. A, diagram illustrating the 12 different categories of gene regulation observed. Red indicates high relative expression, and green indicates low relative expression. The identity of each expression pattern (1–8) is also indicated by its row-side color code (leftmost column), which is used in B–D and supplemental Table S1 to identify the patterns. B, genes significantly altered between any conditions were detected using the significance analysis of microarrays procedure (38), using a False Discovery Rate cut-off of 0.001, resulting in 262 genes identified. Genes were grouped based upon which of the 12 categories their regulation falls within. Each row is color-coded according to its corresponding pattern in A. Individual categories and the genes that constitute each category can be seen in supplemental Table S1. The expression profiles for each gene and condition shows the levels determined in three separate experiments. C, to select genes that follow a specific pattern of expression, the significant genes were range-normalized to the 0–1 range and ranked by similarity to a pattern of regulation (see “Experimental Procedures”). Shown are the gene expression patterns of the genes that were most similar to the pattern shown in the top panel A with the corresponding color code: pale yellow (1), low expression in M21L (αv−) and M21 (αv+) cells in two dimensions, but high relative expression in M21L cells in three dimensions; purple (2), high expression in M21L (αv−) and M21 (αv+) cells in two dimensions, but low relative expression in M21 cells in three dimensions. Relative expression is indicated by color, where green represents low expression and red indicates high expression. D, gene expression patterns (as detailed in C) showing genes with low expression in M21L (αv−) and M21 (αv+) in two dimensions but high relative expression in M21 cells in three dimensions (corresponding to the light red pattern in A). E, RT-PCR verification of microarray data showing sample gene transcriptional modification upon growth for M21 (αv+) versus M21L (αv−) in three-dimensional collagen with or without integrin αv. Graphs shown are mean log10 relative change of three separate experiments. Microarray data are shown alongside the graphs for comparison and are prepared in the manner detailed in C.

