FIGURE 2.
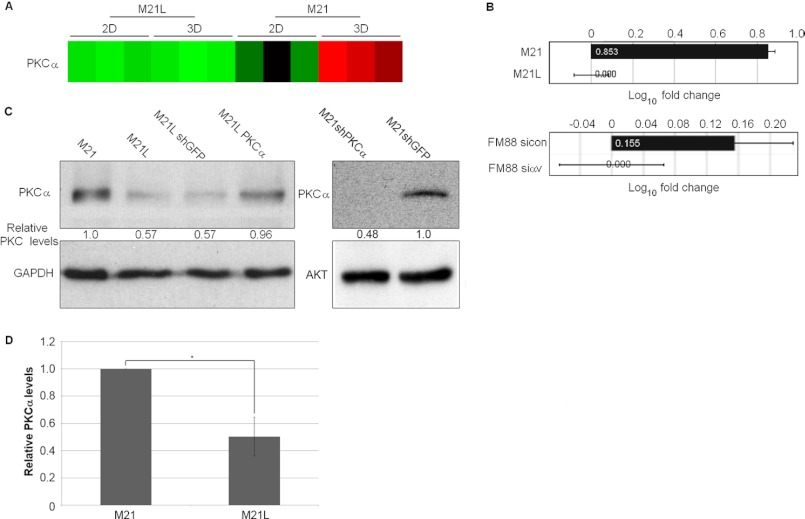
Integrin αv up-regulates melanoma cell PKCα mRNA and protein levels. A, microarray analysis of PKCα transcription levels visualized as displayed in Fig. 1. B, RT-PCR quantification of PKCα mRNA levels in M21 versus M21L cells and FM88sicon versus FM88siαv cells cultured in three-dimensional (3D) collagen for 3 days. Log10 fold change graph shows the mean fold change of three separate experiments. C, levels of PKCα were examined by immunoblotting of lysates from M21, M21L, M21LshGFP, M21LPKC, M21shGFP, and M21shPKCα cells cultured in three-dimensional collagen for 3 days. GAPDH and Akt levels were determined as loading controls. D, quantification of PKCα expression levels as determined by immunoblot of lysates from M21 (αv+) and M21L (αv−) cells grown in three-dimensional collagen for 3 days. Graph shows mean PKCα expression levels corrected to loading controls ± S.E. among three independent experiments with M21 PKCα levels normalized to 1 (*, p < 0.05 using t test). 2D, two-dimensional.

