FIGURE 3.
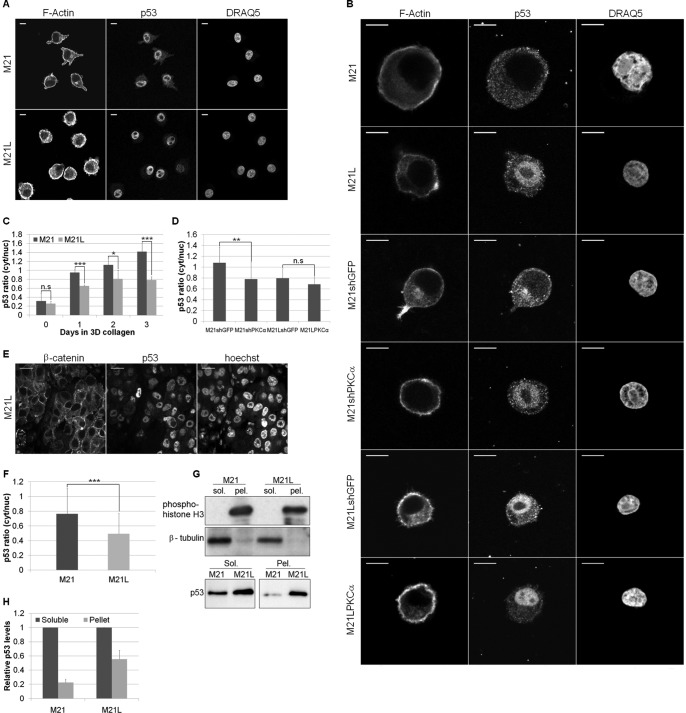
Integrin αv and PKCα regulate p53 localization in three-dimensional collagen. A, immunofluorescence with an anti-p53 antibody was utilized to analyze p53 localization in M21 (αv+) and M21L (αv−) cells grown in two dimensions. F-actin and nuclear staining (DRAQ5) were used to highlight the cell periphery and the nucleus. Scale bar, 10 μm. B, p53 localization in three-dimensional collagen was analyzed by immunofluorescence in M21, M21L, M21shGFP, M21shPKCα, M21LshGFP, and M21LPKCα cells. F-actin and nuclear (DRAQ5) staining were determined to highlight the cell periphery and the nucleus. Scale bar, 10 μm. C, image quantification of M21 and M21L cells in two dimensions (2D; 0 days) and after 1, 2, and 3 days in three-dimensional (3D) collagen. Representative areas of a uniform size were selected within the cell cytoplasm and nucleus, and the mean p53 intensity was determined. A cytoplasm/nucleus intensity ratio was determined to allow comparison across samples and plotted. Graph shows mean p53 ratio ± S.E. among three separate experiments (n = 24–45 cells/condition; n.s., not significant; *, p < 0.05; ***, p < 0.001 using t test). D, quantification of p53 localization in cells with PKCα levels manipulated and control cells after 3 days in three-dimensional collagen. Images for M21shGFP, M21shPKCα, M21LshGFP, and M21LPKCα were analyzed as in C. Graph shows mean p53 ratio ± S.E. among three separate experiments (**, p < 0.01 using t test). E, representative images of an in vivo M21L tumor section as analyzed in F. M21L cells were stained by immunofluorescence with an anti-p53 antibody to establish the p53 localization. β-Catenin and Hoechst were utilized to determine the cell periphery and nucleus, respectively. Scale bar, 10 μm. F, quantification of p53 localization from images of in vivo M21 and M21L tumors grown in a chick CAM assay. Images were analyzed as in C, and the graph shows the mean p53 ratio ± S.E. among three separate experiments (***, p < 0.001 using t test). G, upper: lysate fractionation was assessed by immunoblotting the soluble (sol.) and pellet (pel.) fractions of M21 and M21L lysates for phosphohistone H3 and β-tubulin. Immunoblots are representative of two separate experiments. Lower: soluble and pellet levels of p53 were determined by immunoblotting lysates from M21 and M21L cells. The immunoblot is representative of three separate experiments. H, quantification of soluble and pellet p53 levels as determined by immunoblot. Graph shows mean p53 levels ± S.E. among three independent experiments with soluble p53 levels normalized to 1.

