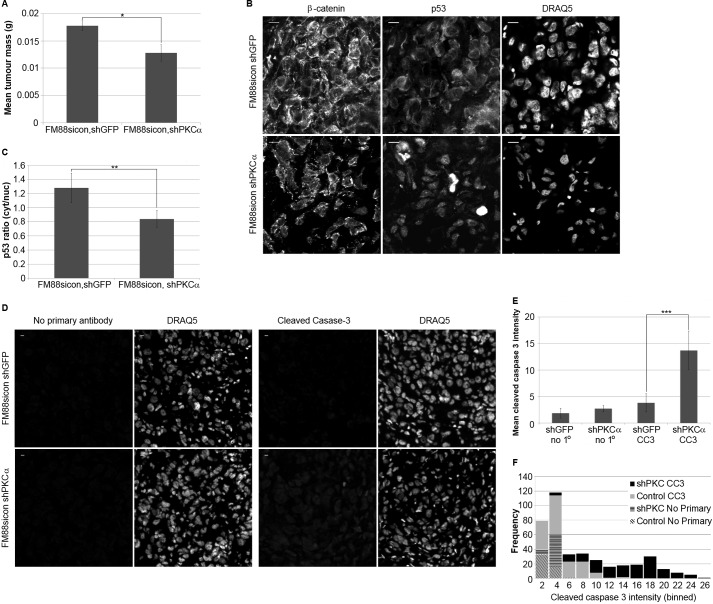
FIGURE 5.
PKCα regulates p53 localization and apoptosis in vivo and promotes melanoma tumor growth. A, FM88sicon, shGFP (control) and FM88sicon, shPKCα (PKCα-) melanoma cells were subcutaneously injected into Balb/c nude mice. Tumors were removed from mice after 18 days of growth. Removed tumors were weighed on electronic scales. Graph shows mean tumor wet weight ± S.D. (n = 7, *, p < 0.05 using t test). B, localization of p53 was observed in FM88 tumor sections with an FITC-conjugated anti-p53 antibody. β-Catenin and nuclear (DRAQ5) staining was performed to visualize the cell periphery and nucleus, respectively. Representative images of FM88sicon, shGFP and FM88sicon, shPKCα tumor sections are shown. Scale bar, 10 μm. C, quantification of p53 localization in FM88 tumor sections. Representative areas of a uniform size were selected within the cell cytoplasm and nucleus, and the mean p53 intensity was determined. Graph shows mean p53 ratio ± S.D. (n = 60–120 cells/tumor, five tumors per cell type; **, p < 0.01 using t test). D, apoptosis in FM88 tumor sections was analyzed by immunofluorescence using an anti-cleaved caspase-3 antibody. Nuclear (DRAQ5) staining was performed to visualize the nucleus. Tumor sections stained with no primary antibody added were used as a background fluorescence control. E, representative areas of a uniform size were selected using the DRAQ5 channel, and the mean intensity of cleaved caspase-3 was determined. Graph shows mean cleaved caspase-3 intensity ± S.E. (n = 50 cells/tumor, three tumors/cell type; ***, p < 0.001 using t test). F, data from E plotted as a histogram showing frequency of cleaved caspase-3 intensity for each tumor type.

