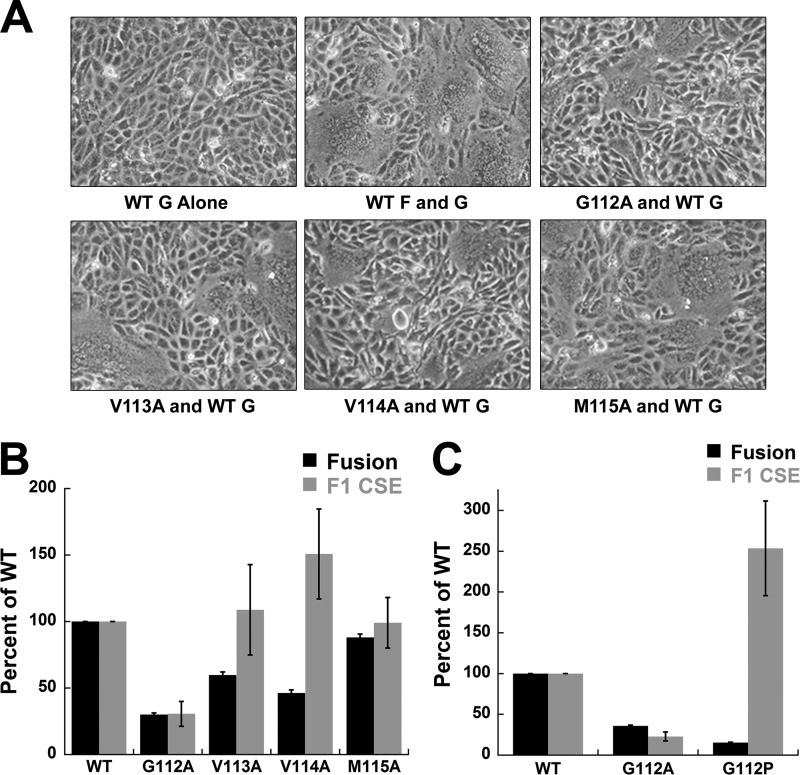
FIGURE 6.
Fusogenicity of wild-type and single alanine mutant F proteins. A, shown is a syncytia assay for each of the four mutants as compared with wild type. The experiment was performed as described in Fig. 3A and under “Experimental Procedures.” Images are representative of one of three independent experiments. B and C, shown is a quantitative reporter gene analysis and quantitation of F1 cell-surface expression for FP mutants as compared with wild-type F performed as described in Fig. 3B and under “Experimental Procedures.” All data are presented as the means ± S.E. for at least three independent experiments.

