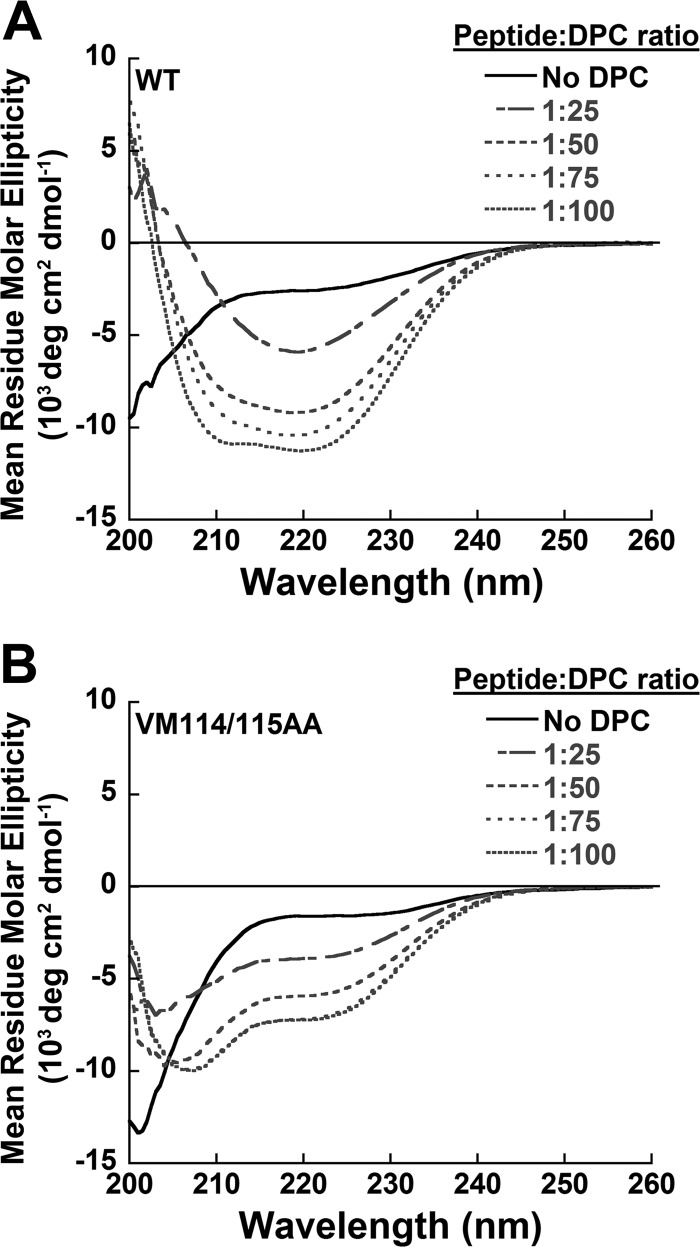
FIGURE 9.
Dependence of peptide secondary structure on effective peptide concentration. A, CD spectra of wild-type peptide at various DPC concentrations are shown. B, CD spectra of VM114/115AA peptide at various DPC concentrations are shown. Spectra in both A and B are representative of one of three independent experiments where each spectrum is an average of four scans.

