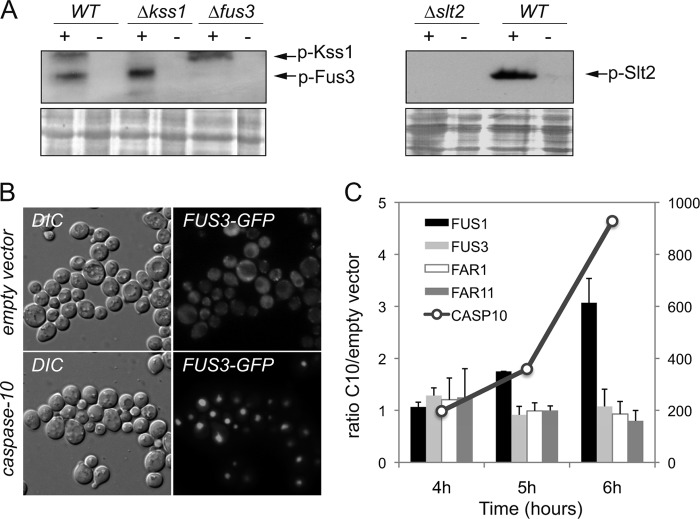
FIGURE 1.
The MAP kinases Fus3, Kss1, and Slt2 are activated after the expression of caspase-10. A, Western blot of protein extracts from yeast strains BY4741 (WT), kss1Δ, fus3Δ, and slt2Δ transformed with either the pESC-URA/CASP10 (+) or the pESC-URA empty vector (−). Cells were grown in SG-Ura medium for 6 h before the cultures were harvested. The anti-p44/42 (E10, Cell Signaling), which detects the phosphorylated forms of Fus3, Kss1, and Slt2, was used as primary antibody. Ponceau red staining of the blot was used as a protein loading control. B, fus3Δ cells co-transformed with a YCplac22/FUS3-GFP plasmid and either the pESC-URA empty vector or the pESC-URA/CASP10 vector were grown in galactose-containing medium for 6 h. The subcellular localization of the Fus3-GFP fusion was analyzed by fluorescence microscopy. C, relative transcription levels of FUS1, FUS3, FAR1, FAR11, and CASP10 in BY4741 cells transformed with either the pESC-URA empty vector or the pESC-URA/CASP10 plasmid. Total mRNA was obtained from yeast cells at different time points (4, 5, and 6 h) after the induction of caspase-10 expression in galactose-containing medium. Transcription levels were normalized using the ACT1 gene as a reference. Relative quantitative analyses were performed using LightCycler 480 software. The results are the average of two independent experiments and are expressed as a ratio of the cDNA abundance of the target genes in BY4741/pESC-URA/CASP10 cells with respect to BY4741/pESC-URA cells. CASP10 transcription levels are indicated on the scale at the right of the graph.

