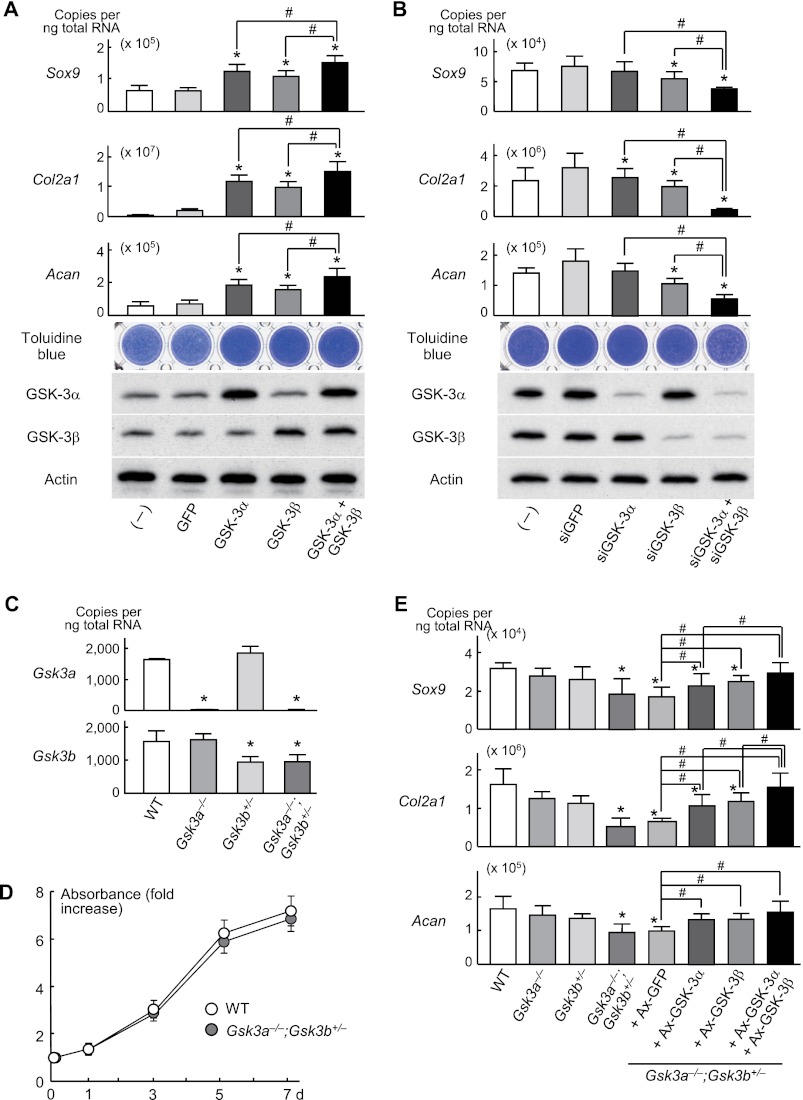
FIGURE 3.
A, mRNA levels of Sox9, Col2a1, Acan, and toluidine blue staining in stable lines of ATDC5 cells retrovirally transfected with GSK-3α, GSK-3β, a combination of both, or the control GFP and in nontransfected parental cells (−) after 1 week of differentiation induction by ITS treatment. Data are expressed as means ± S.D. for three wells/group. GSK-3α and GSK-3β levels were confirmed by Western blotting, with actin as the loading control. Data are expressed as means ± S.D. for three wells/group. B, analyses of the same read-outs in stable lines of ATDC5 cells retrovirally transfected with siRNA specific for GSK-3α, GSK-3β, a combination of both, or the control siGFP and in nontransfected parental cells (−) after 1 week of the ITS treatment. Data are expressed as means ± S.D. for three wells/group. GSK-3 levels were determined by Western blotting. C, mRNA levels of Gsk3a and Gsk3b in the pellet cultures of primary chondrocytes derived from wild-type (WT), Gsk3a−/−, Gsk3b+/−, and Gsk3a−/−;Gsk3b+/− littermates. Data are expressed as means ± S.D. for three wells/group. D, cell proliferation curves by the CCK-8 assay during 7-day cultures of primary chondrocytes derived from WT and Gsk3a−/−;Gsk3b+/− littermates. There was no significant difference between groups (p > 0.05). Data are expressed as means ± S.D. for three wells/group. E, mRNA levels of Sox9, Col2a1 and Acan in the pellet cultures of primary chondrocytes derived from WT, Gsk3a−/−, Gsk3b+/−, and Gsk3a−/−;Gsk3b+/− littermates. For the rescue experiment, adenoviral (Ax) transfection with GSK-3α, GSK-3β, their combination, or control GFP was performed before pellet formation. All data are expressed as means ± S.D. for three wells/group. *, p < 0.05 versus GFP, siGFP, or WT. #, p < 0.05 as indicated.

