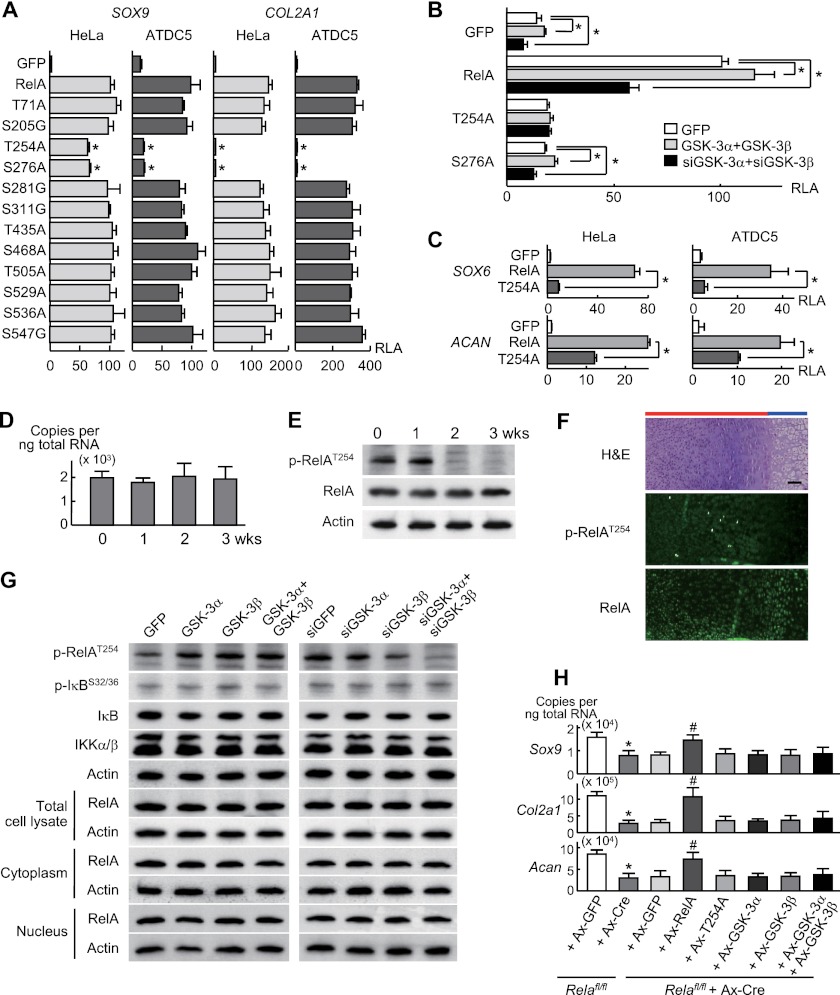
FIGURE 5.
A, luciferase activity after transfection with RelA or RelA mutants with replacement of putative phosphorylation sites with nonphosphorylatable residues or control GFP into stable lines of HeLa and ATDC5 cells containing either SOX9 gene reporter construct or COL2A1 enhancer-luciferase reporter construct. Data are expressed as means ± S.D. for three wells/group. *, p < 0.01 versus RelA. RLA, relative luciferase activity. B, luciferase activity after transfection with GFP, RelA, or two RelA mutants (T254A and S276A) in stable lines of ATDC5 cells containing the SOX9 gene reporter construct, which were retrovirally co-transfected with a combination of GSK-3α and GSK-3β, siGSK-3α and siGSK-3β, or GFP. Data are expressed as means ± S.D. for three wells/group. *, p < 0.05 as indicated. C, luciferase activity after transfection with GFP, RelA, or RelA mutant T254A into ATDC5 cells as described above containing the SOX6 (−2,000 to −1 bp) or ACAN (−4,000 to −1 bp) gene reporter construct. Data are expressed as means ± S.D. for three wells/group. *, p < 0.05 as indicated. D, mRNA levels of Rela during differentiation of ATDC5 cells cultured for 3 weeks. Data are expressed as means ± S.D. for three wells/group. E, immunoblotting using antibodies to Thr-254-phosphorylated RelA (p-RelAT254) and RelA in cultured ATDC5 cells above. F, H&E staining and immunofluorescence with antibodies to p-RelAT254 and RelA in the proximal tibias (E18.5). Scale bar, 100 μm. Red and blue bars indicate layers of proliferative and hypertrophic zones, respectively. G, immunoblotting using the antibodies to p-RelAT254, phosphorylated IκB (p-IκB), IκB, and IKKα/β, and RelA (total cell lysate, cytoplasmic and nuclear fractions) in stable lines of ATDC5 cells retrovirally transfected with GFP, GSK-3α, GSK-3β, or their combination (left) and with siRNA specific for GFP, GSK-3α, GSK-3β, or their combination (right) after stimulation with ITS. H, mRNA levels as above after adenoviral transfection with GFP or Cre in primary chondrocytes from Relafl/fl mice. For the rescue experiment, adenoviral transfection with GFP, RelA, T254A, GSK-3α, GSK-3β, and their combination was performed 24 h after Cre transfection in Relafl/fl chondrocytes. *, p < 0.05 versus Relafl/fl+Ax-GFP. #, p < 0.05 versus Relafl/fl+Ax-Cre+Ax-GFP. All data are expressed as means ± S.D. for three wells/group.

