FIGURE 2.
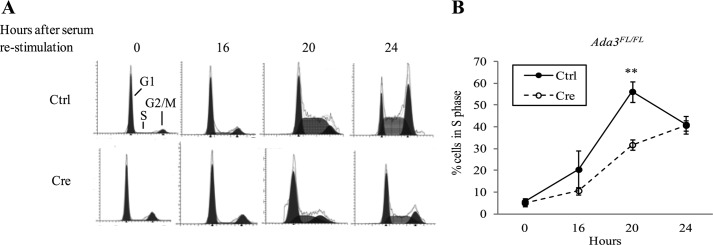
Ada3 disruption delays G1 to S transition in MEFs. A, control (Ctrl)- or Cre- infected Ada3FL/FL MEFs were serum-starved for 72 h and then released from synchrony as described under “Experimental Procedures” and processed for PI staining followed by FACS analysis. Cells in different phases of the cell cycle are shown from a representative experiment. B, graph derived from three independent experiments performed as in A, showing the proportion of cells entering into S phase at the indicated times after serum restimulation. Error bars are mean ± S.E. from three independent experiments (**, p = 0.0096, two-tailed Student's t test).

