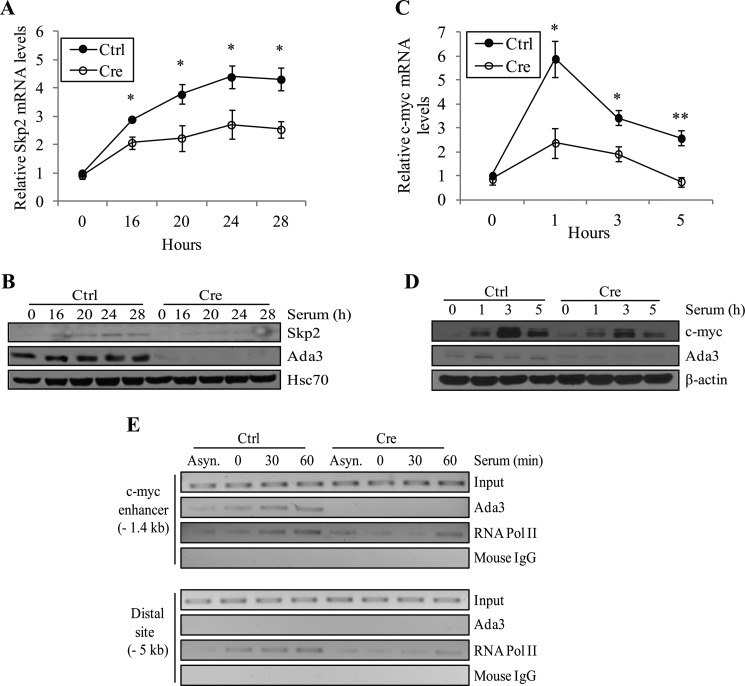
FIGURE 6.
Deletion of Ada3 from MEFs leads to reduced mRNA and protein levels of Skp2 and c-Myc. A, analysis of Skp2 mRNA levels by real-time RT-PCR from cells as treated in Fig. 2. Signals were normalized to β-actin levels and plotted relative to the level of Skp2 mRNA in starved control cells. Error bars represent mean ± S.E. from three independent experiments (*, p = 0.015, 0.036, 0.043, and 0.032 for 16, 20, 24, and 28 h, respectively by two-tailed Student's t test). B, immunoblots showing Skp2 protein levels in cells treated as in A. C, analysis of c-Myc mRNA levels by real-time RT-PCR from cells as treated in Fig. 5. Signals were normalized to β-actin levels and plotted as in A. Error bars show mean ± S.E. from three independent experiments. D, immunoblots showing c-Myc protein levels in cells treated as in C (*, p = 0.023 and 0.027 for 1 and 3 h, respectively; **, p = 0.008 by two-tailed Student's t test). E, occupancy of Ada3 on the c-myc enhancer. Chromatin fragments from control (Ctrl) and Cre Ada3FL/FL MEFs cells were immunoprecipitated with anti-Ada3 antibody. Chromatin fragments were prepared from Asynchronous (Asyn.) cells as well as from cells synchronized with 0.1% serum containing DMEM for 72 h (lane 0) and stimulated with serum with indicated time points. The immunoprecipitated DNA was analyzed by PCR, using c-Myc enhancer-specific primers. Primers amplifying a region that is 5 kb upstream of the c-Myc enhancer were used as a negative control. RNA Pol II, RNA polymerase II.

