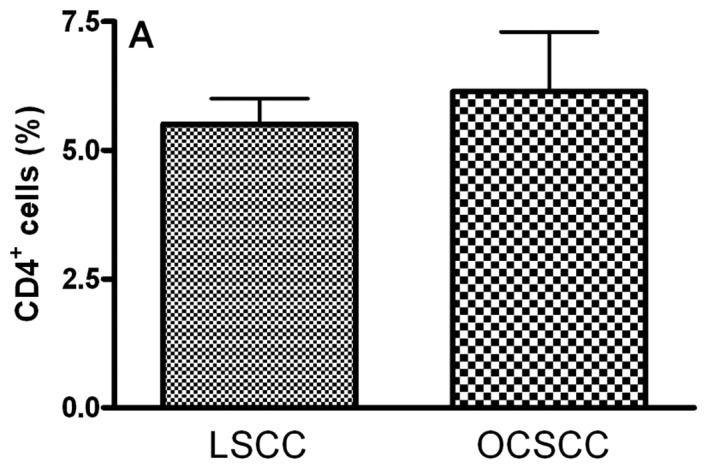
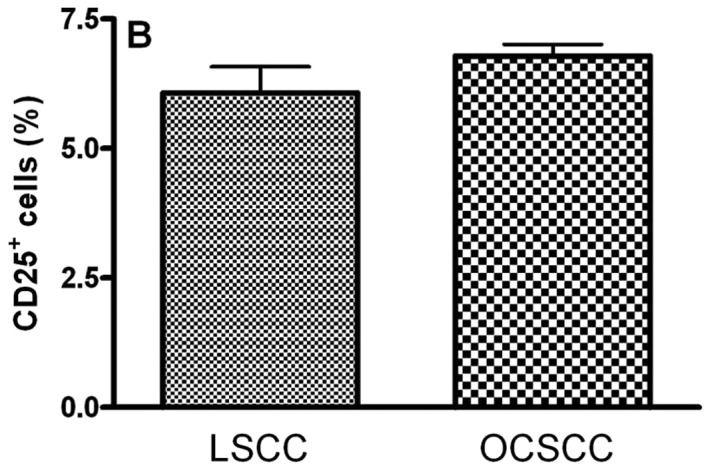
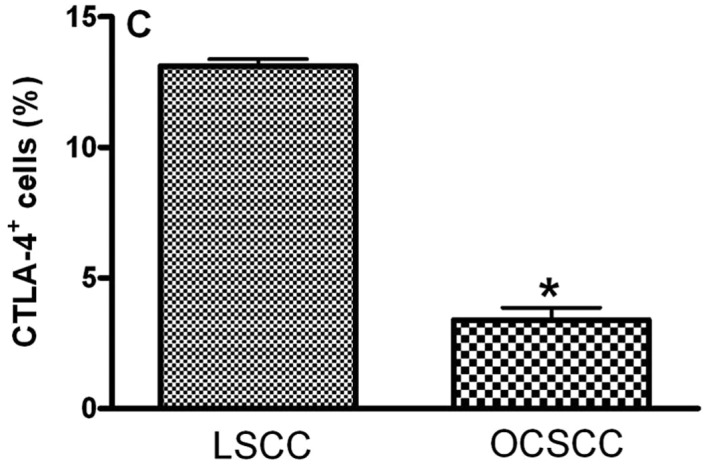
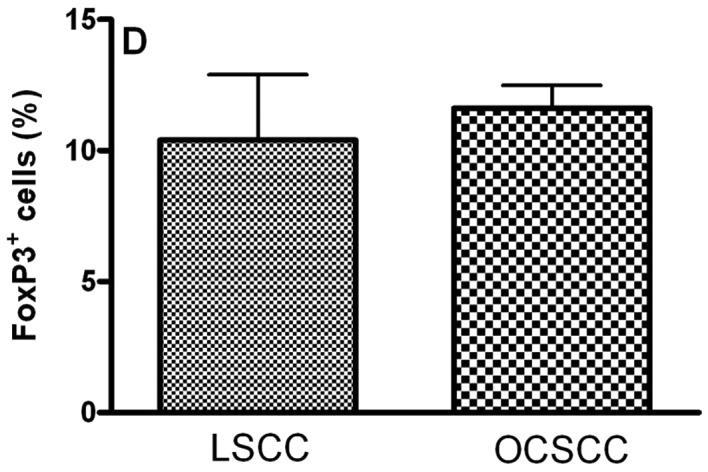
Figure 1.


Densities of (A) CD4+, (B) CD25+, (C) CTLA-4+ and (D) FoxP3+ cells in primary oral cavity squamous cell carcinoma (OCSCC) (n=18) and lip squamous cell carcinoma (LSCC) (n=8). The percentage of positive cells was calculated as the proportion of the total of inflammatory cells. Results are expressed as the mean of positive cells ± SD. *Indicates a significant difference, when comparing metastatic OCSCC and LSCC, P<0.05.
