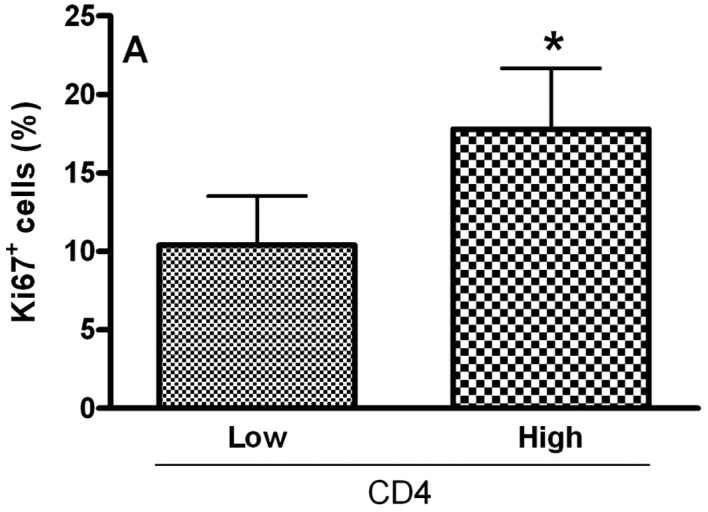
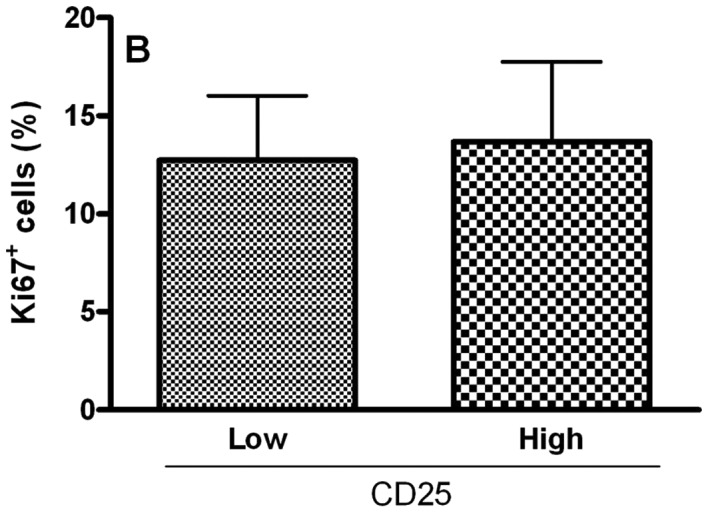
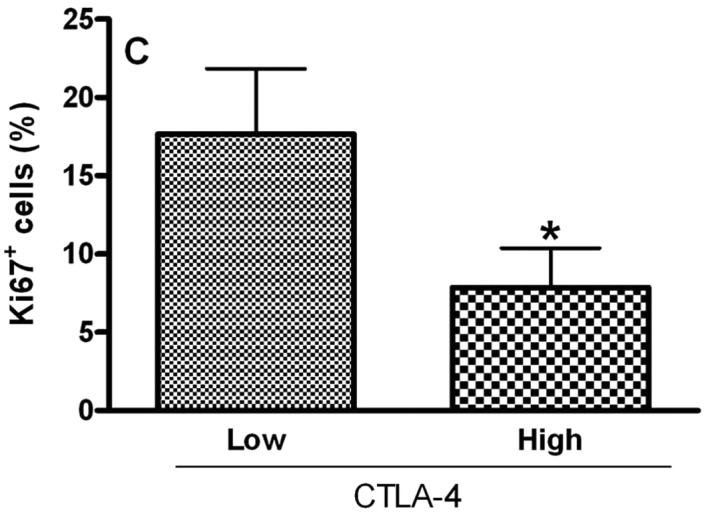
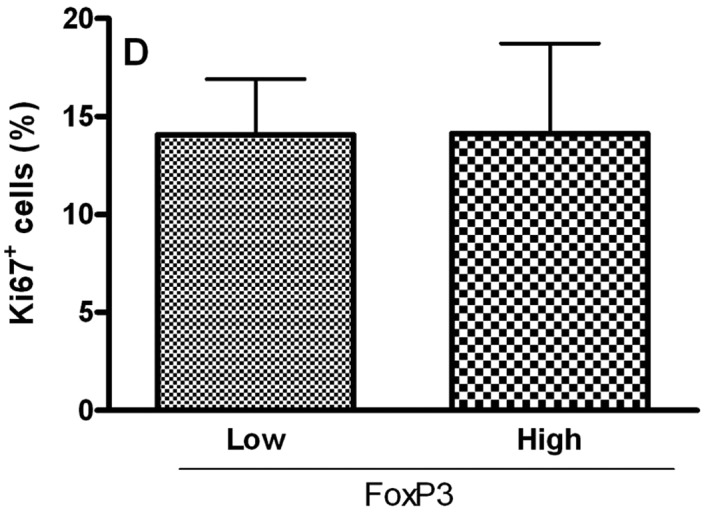
Figure 2.


Relationship between the proliferative index and densities of (A) CD4, (B) CD25, (C) CTLA-4 and (D) FoxP3 in OCSCC (n=18). The values of CD4, CD25, CTLA-4 and FoxP3 were dichotomized into high and low groups using the median values. The proliferative index of the tumor was determined by evaluating the number of cells showing Ki67 staining as a proportion of the total epithelial cell population. The results are expressed as the mean of positive cells ± SD. *Indicates a significant difference, when comparing high and low groups; P<0.05.
