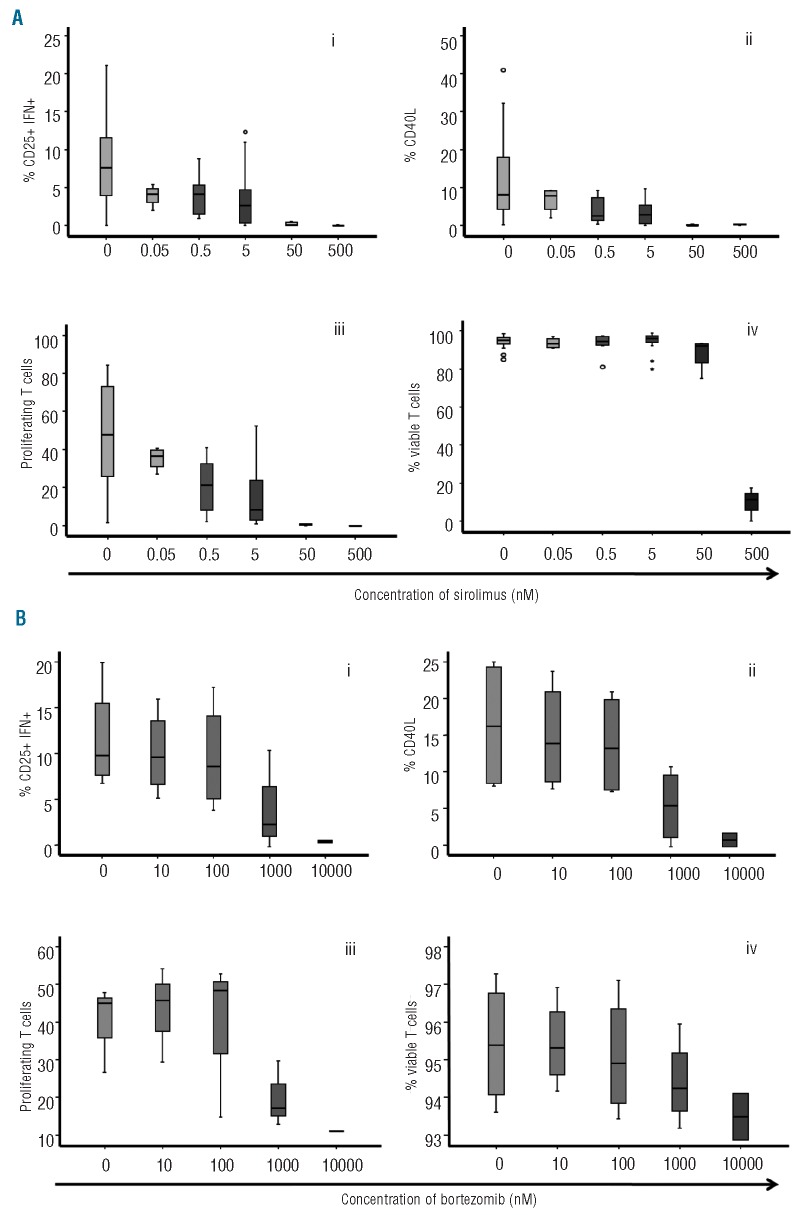
Figure 1.
(A) Box-plot showing the dose-dependent effect of sirolimus on T-cell activation (i,ii) and proliferation (iii). Viability (iv) of T cells only decreased at doses ≥ 500 nM. (B) Box-plot showing the dose-dependent effect of bortezomib on T-cell activation (i,ii), proliferation (iii) and viability (iv). Its effect was not significant for doses ≤ 100 nM for any of the parameters considered. Circles represent values > 95% confidence interval and stars values > 98% CI; 7 cases were analyzed

