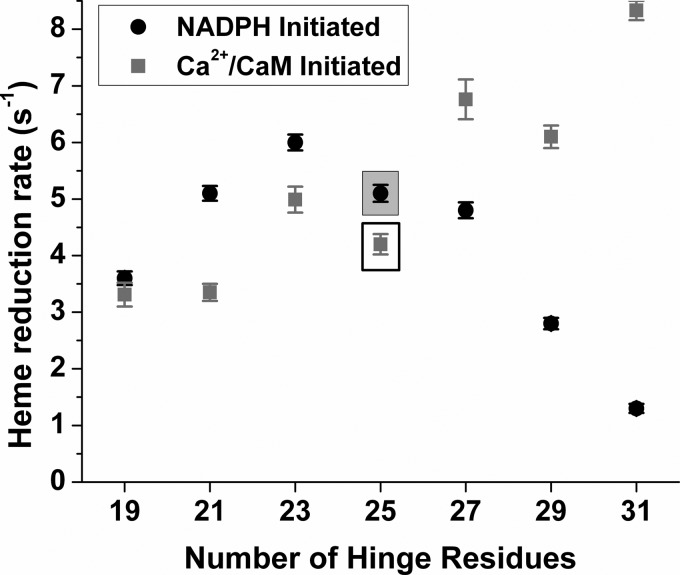
FIGURE 4.
Rate of ferric heme reduction versus FMN-FAD/NADPH hinge length. All reactions were performed at 10 °C in a stopped-flow spectrophotometer as described under “Experimental Procedures.” Heme reduction was triggered by either NADPH or CaCl2 addition. The rates observed for wild-type nNOS are boxed. Values are the means ± S.D. of 7–10 individual reactions and are representative of experiments done with two enzyme preparations for each.

