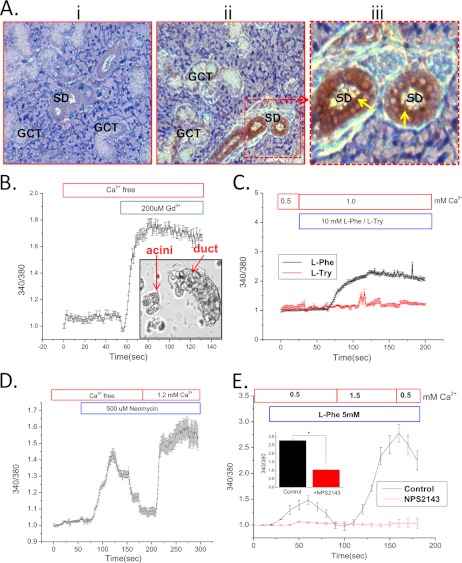
FIGURE 1.
Localization and function of CSR in salivary duct. A, immunocytochemical localization of CSR in SMG tissue section showing labeling (diaminobenzidine; brown precipitate) with control (rabbit IgG) (i) and anti-CSR antibody (ii) to granular convoluted (GCT) and striated ducts (SD). Yellow arrows in iii (enlargement of middle panel) indicate dense signal at the apical region in striated ducts. B, inset, representative of freshly dispersed SMG cells isolated, showing highly distinguishable ducts and acini. These cells are loaded with fura-2 and used for [Ca2+]i measurement. Ductal cells were selected under the microscope for imaging. B–E, mean fluorescence traces (obtained from 3–4 separate experiments, 30–40 cells) of fura-2-loaded SMG ducts. Gd3+ (200 μm) was added (B) to cells in a Ca2+-free medium. C, application of l-Phe/l-Tryptophan (l-Try) (10 mm) in medium containing 1 mm Ca2+. D and E, activation of CSR and Ca2+ entry by neomycin (500 μm) (D) and l-Phe (5 mm) (E) at different external [Ca2+]. A complete block of CSR by NPS-2143 is shown in cells incubated with l-Phe (E, red traces). E, inset, peak [Ca2+]i significantly decreased (p < 0.01) in response to control (l-Phe) and NPS-2143- (1 μm) treated cells. Changes in external [Ca2+] and other conditions are otherwise indicated in the figure.

