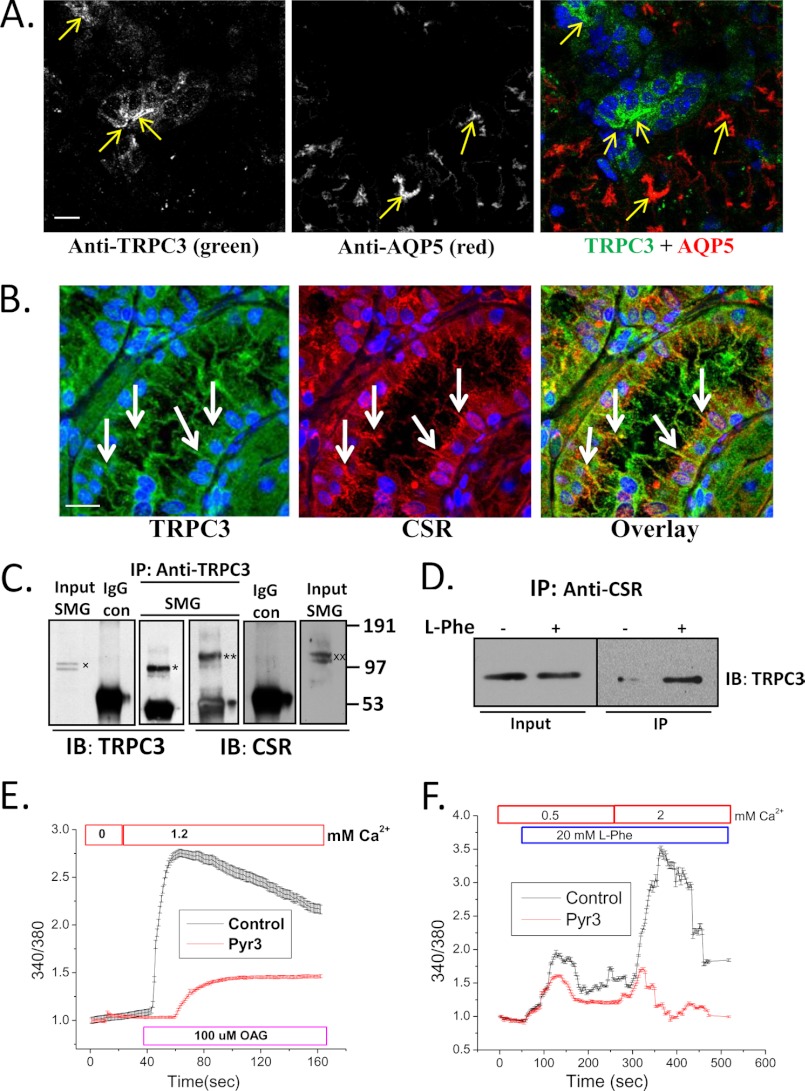
FIGURE 2.
Co-localization and interaction of TRPC3 and CSR in salivary gland duct. A, immunofluorescence detection of TRPC3 and AQP5 in SMG tissue using anti-TRPC3 and anti-AQP5 antibodies. Yellow arrows indicate labeling with TRPC3 (left), AQP5 (middle), and overlay (right); blue color shows DAPI-stained nucleus. Scale bar, 20 μm. B, confocal microscopy detection of TRPC3 and CSR in mouse SMG sections using anti-TRPC3 and anti-CSR antibodies. White arrows indicate TRPC3 (left; green), CSR (middle; red), and overlay of TRPC and CSR (right; yellow). Nuclei were stained with DAPI (blue). Scale bar, 20 μm. Using the Volocity software to threshold the signals, almost complete overlap was seen between green and red colors. In an unthresholded image the overlap was approximately 70%. C, Western blots (IB) showing co-immunoprecipitation of TRPC3 (*) and CSR (**) using anti-TRPC3 antibody for immunoprecipitation (IP). Anti-TRPC3 and anti-CSR antibodies were used to detect the two proteins in the IP fraction. Controls of co-IPs are shown using rabbit IgG instead of primary antibody. Input of TRPC3(x) and CSR (xx) are also shown (1/10–1/20 of the IP). D, freshly dispersed SMG primary cells were treated (+) with l-Phe (10 mm) plus 1.2 mm Ca2+, lysed with RIPA buffer, and then immunoprecipitation was performed using anti-CSR antibody. Untreated (−) cells were used as control. Western blotting (IB) using anti-TRPC3 antibody was used for detection of the protein in the IP fraction and lysates (input; 1/10 of IP). E and F, mouse SMG (freshly dispersed) cells were loaded with fura-2 for 30 min. Graphs are representative of mean fluorescence traces (3–4 separate experiments) of fura-2-loaded SMG duct (selected under microscope while imaging). E, OAG (100 μm) activation in cells treated (3 μm Pyr3; TRPC3 inhibitor) or not (control). F, Ca2+ entry in response to CSR activation by l-Phe (control; 20 mm) and block of this function in cells treated with Pyr3 (3 μm). All other additions are indicated in the figure.

