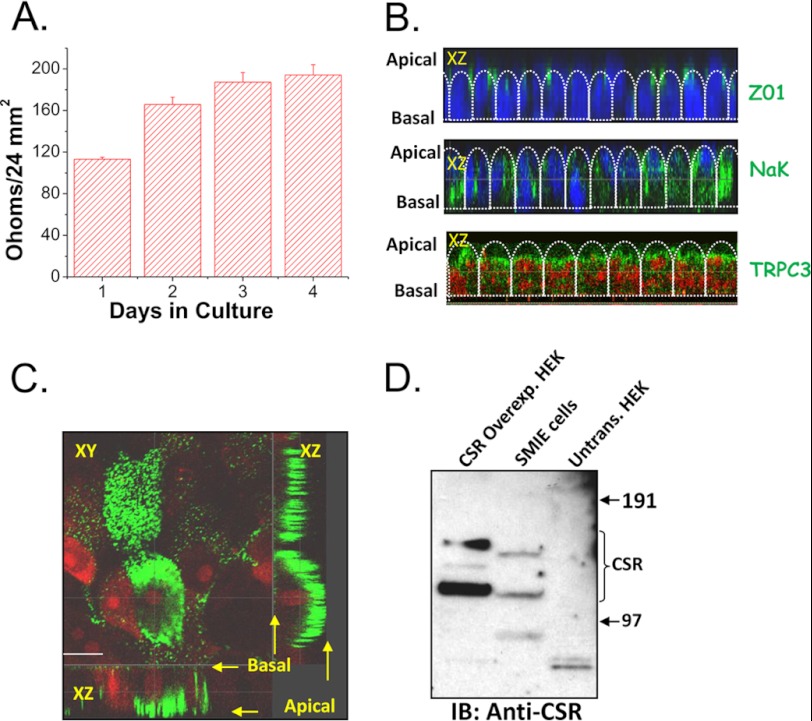
FIGURE 5.
Localization of CSR and TRPC3 in polarized SMIE cells. A, bar diagram of TER showing the establishment of polarity while cells were growing onto Transwell filter. Error bars, S.D. B, representative images of confocal X-Z sections of polarized SMIE cells grown in Transwell filter support. Top panel represents the staining with Z01 (green signal), a tight junction marker at the junction of apical and lateral region. The middle panel shows Na+,K+-ATPase (NaK; basolateral marker), indicating lateral localization (green signal); nuclei are stained with DAPI (blue signal). Bottom panel shows apical localization of TRPC3 (green signal), indicating an apical expression of TRPC3; nuclei are stained with propidium iodide (red signal). C, confocal sections (XY and XZ) of polarized SMIE cells (grown onto a Transwell filter) labeled with anti-CSR antibody (rabbit, 1:100 dilution). D, Western blot (IB) using anti-CSR antibody (Rabbit, 1:500 dilution) showing the expression of endogenous CSR protein in SMIE cells and overexpression of CSR in typical HEK cells glycosylated bands (bands did not result in untransfected cells).

