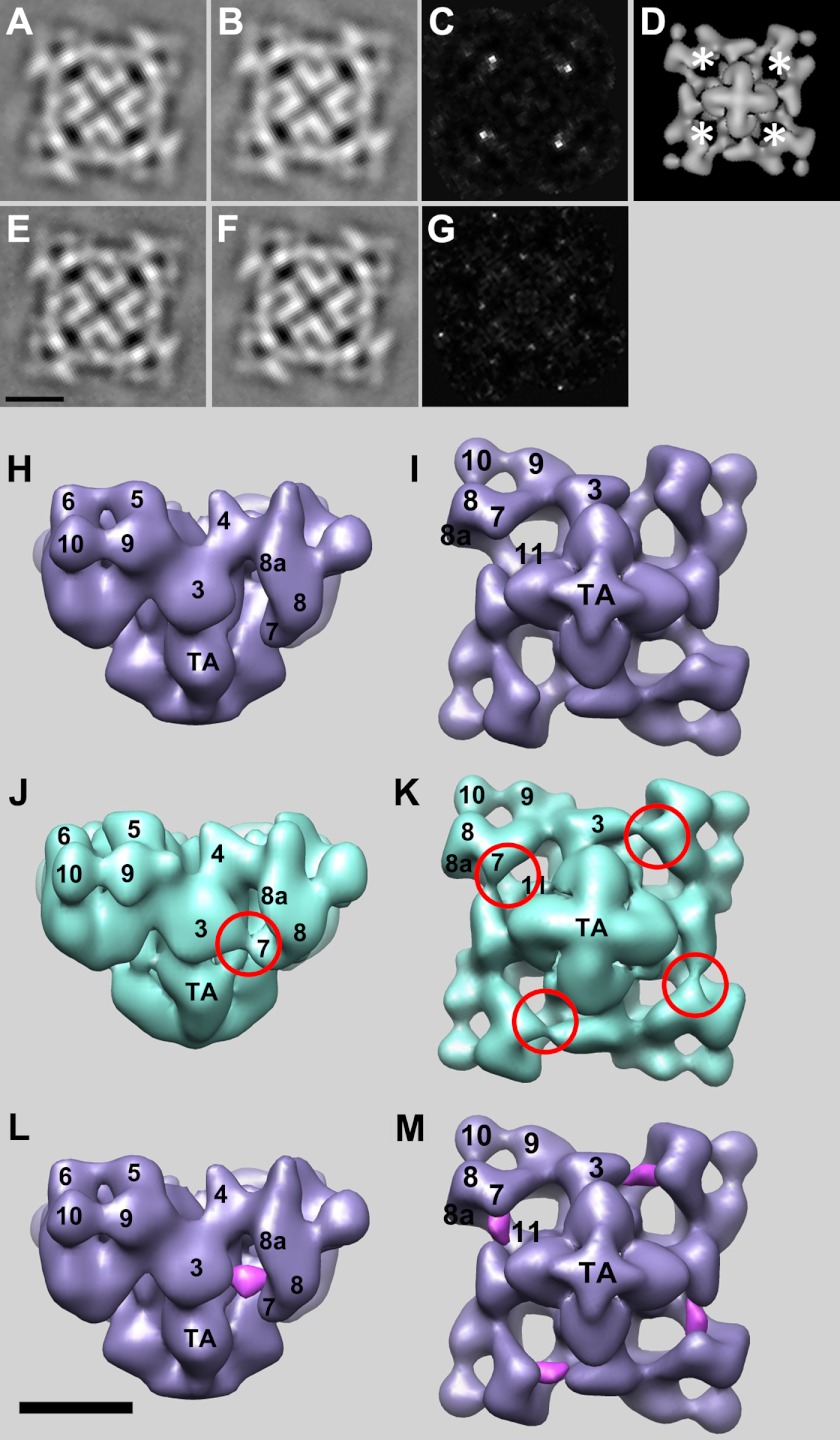
FIGURE 4.
Two- and three-dimensional localizations of RyR2-bound apo-CaM. A and B, 4-fold symmetrized two-dimensional averages of apo-CaMWT-RyR2 and the CaM-free control, respectively, in low calcium buffer (3 mm EGTA). C, difference map generated by subtracting B from A. The white regions are the positions of positive differences. The biggest differences are in bright white. D, locations of the positive differences (asterisks) in C superimposed on the bottom view of a three-dimensional reconstruction of RyR1. E and F, 4-fold symmetrized two-dimensional averages of Ca2+-CaMWT-RyR2 and the CaM-free control, respectively, in high calcium buffer (0.1 mm CaCl2). G, difference map generated by subtracting F from E, showing no significant positive differences. H and I, three-dimensional reconstruction of the CaM-free RyR2 control. H shows a side view, and I shows a 4-fold view of the bottom (membrane-facing) surface. J and K, side view and bottom 4-fold view, respectively, of the apo-CaMWT-RyR2 complex. Red circled regions highlight the major differences between the apo-CaMWT-RyR2 complex and the CaM-free RyR2 control. L and M, positive densities (purple) attributed to RyR2-bound apo-CaMWT that were generated by volume subtraction of the CaM-free RyR2 control from apo-CaMWT-RyR2, which suppresses the positive differences due to FKBP12.6. Scale bar = 10 nm.

