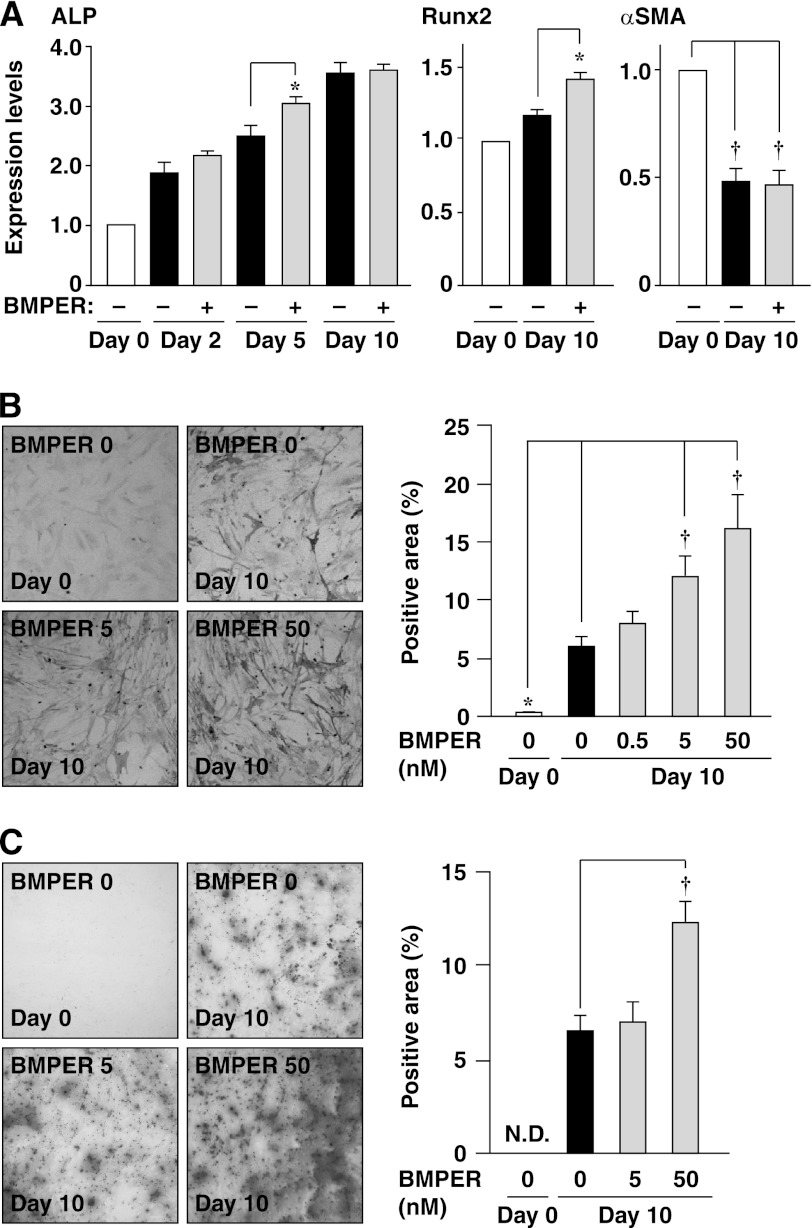
FIGURE 3.
Enhancement of spontaneous osteoblast-like differentiation of HCASMCs by recombinant BMPER. A, mRNA expression of ALP and αSMA analyzed by real-time PCR (n = 3). Each value was standardized by the GAPDH mRNA expression and is presented as the fold increase over that in the absence of BMPER. B, ALP staining of HCASMCs treated with the indicated concentrations of recombinant BMPER for 10 days (n = 5). Representative images are shown on the left. The right graph shows the percentages of the ALP-positive area relative to the total surface area of HCASMCs. C, alizarin red staining of HCASMCs treated with the indicated concentrations of recombinant BMPER for 10 days (n = 5). Representative images are shown on the left. The right graph shows the percentages of the alizarin red-positive area relative to the total surface area of HCASMCs. *, p < 0.05, †, p < 0.01.

