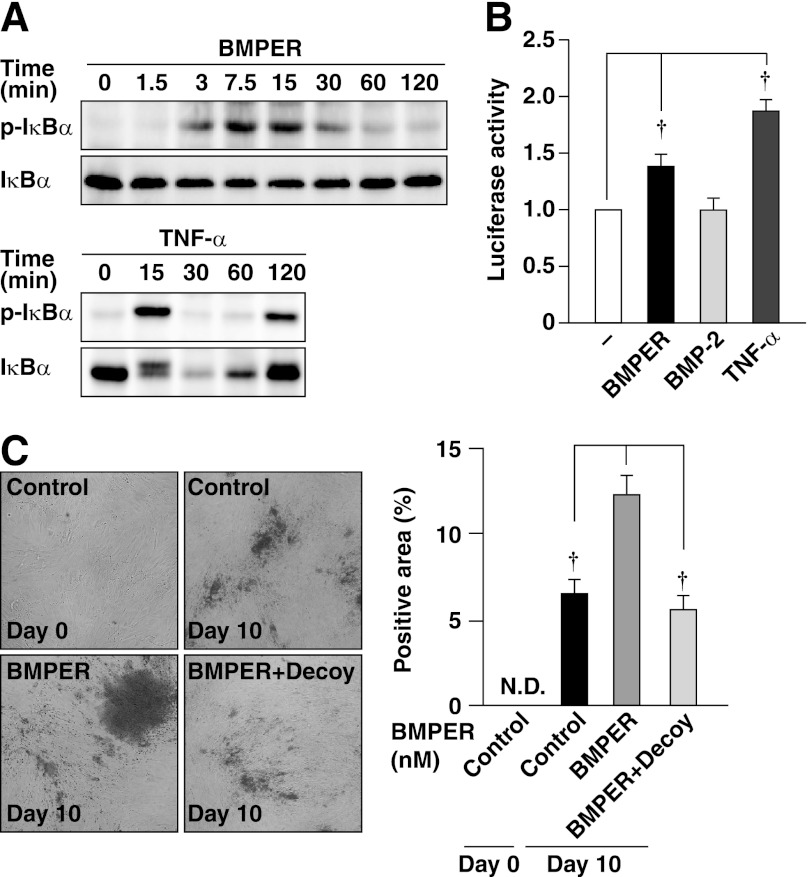
FIGURE 6.
Involvement of NF-κB in the action of BMPER. A, phosphorylation and degradation of IκBα by BMPER. Cell lysates of HCASMCs treated with 50 nm BMPER or 10 ng/ml TNF-α for the indicated time periods were subjected to Western blotting. B, activation of NF-κB by BMPER. HCASMCs were treated with 50 nm BMPER, 300 ng/ml BMP-2 or 10 ng/ml TNF-α for 2 h. The emission intensity of each sample was standardized by that of the control cells (no stimulation) and is shown as the fold increase over the control value (n = 3). C, alizarin red staining of HCASMCs cultured in the presence or absence of 0.5 μm NF-κB decoy or 50 nm BMPER for 10 days (n = 5). Representative images are shown on the left. The right graph shows the percentages of the alizarin red-positive area relative to the total surface area of HCASMCs. †, p < 0.01.

