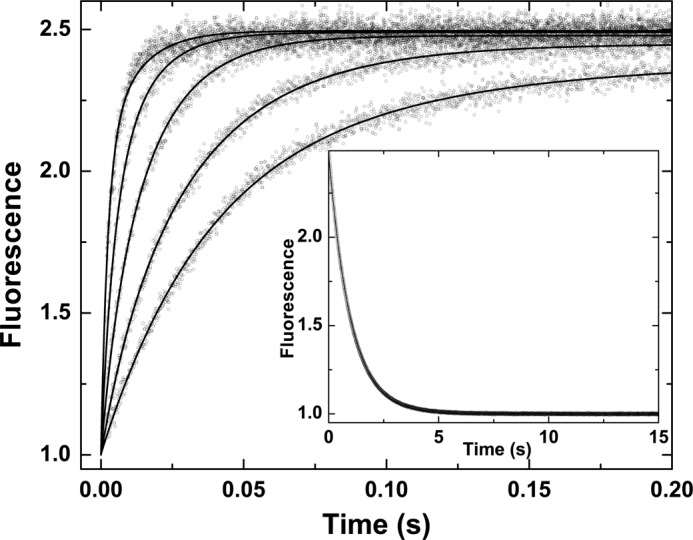
FIGURE 2.

Kinetics of I-2581 binding to thrombin. Selected fluorescence traces are illustrated following rapid mixing of thrombin with increasing concentrations of I-2581 to yield final concentrations of 0.3 μm thrombin and 0.5, 1, 2, 4, and 8 μm (bottom to top) I-2581. Inset, dissociation trace obtained following reaction of 0.6 μm thrombin preincubated with 4 μm I-2581 with 800 μm FPRck. The lines are drawn following global analysis of these and other data according to Scheme 1 to yield the fitted constants listed in Table 1.
