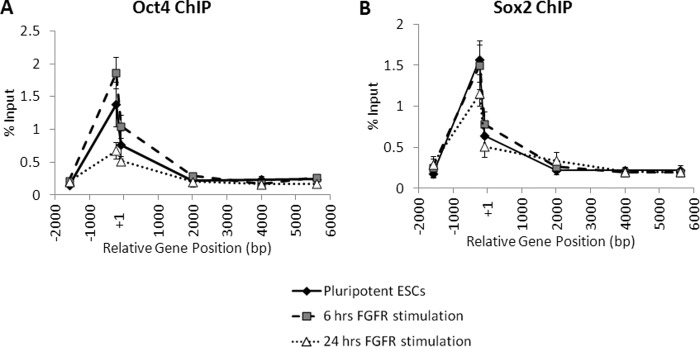
FIGURE 7.
FGFR2 homodimerization does not induce Oct4 and Sox2 dissociation from the Nanog promoter region. Real-time PCR analysis of enrichment of Oct4 (A) or Sox2 (B) at the Nanog locus in ES cells (ESCs) harvested after 0, 6, or 24 h of treatment with AP20187 (10 nm). Enrichment is expressed as % input. Samples were run in triplicate for each primer, and the average % input is plotted. Error bars indicate S.D.

