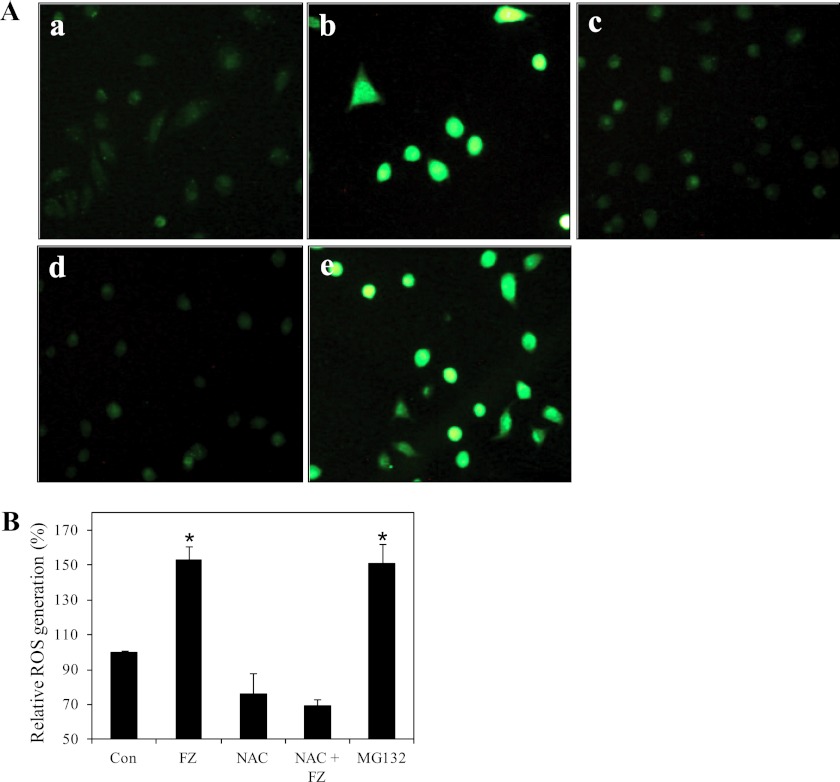
FIGURE 9.
FZ increases ROS generation. A, A549 cells were treated with 1 μm FZ or 10 μm MG132 for 4 h. NAC (10 mm) was added 2 h before drug treatment. The cells were then stained with DCFDA for detection of ROS by fluorescence microscopy. a, control; b, FZ; c, NAC; d, NAC followed by FZ; e, MG132. B, for quantitative analysis, fluorescence intensity was measured at 530 nm after excitation at 485 nm in a PerkinElmer Life Sciences Victor 3X fluorometer. *, p < 0.01 as compared with control untreated cells. Error bars, S.D.

