FIGURE 3.
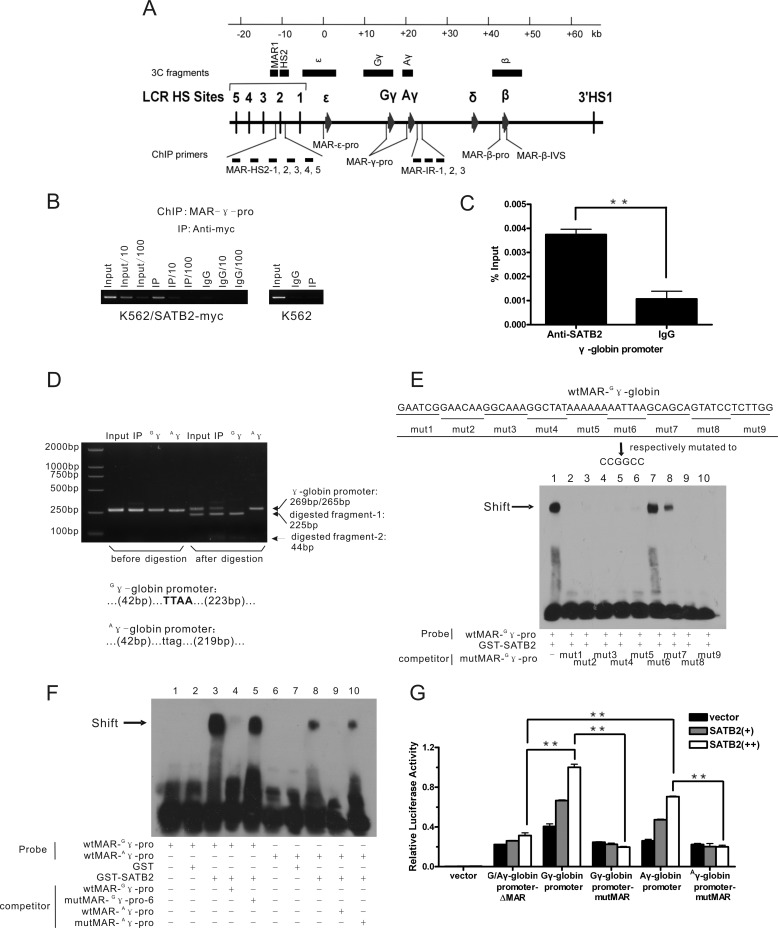
SATB2 occupies G/Aγ-globin promoters in K562 cells. A, schematic representation of the human β-globin locus indicating the locations of ChIP primers (see also supplemental Fig. S3) and 3C fragments (HindIII fragments) used in this study (see Fig. 5, E and F). B, ChIP analysis of myc-SATB2 binding status at the γ-globin gene promoter in K562 cells ectopically expressing Myc-tagged SATB2 using an anti-Myc antibody. Serial dilution was employed for semi-quantitative assay. C, ChIP analysis using anti-SATB2 antibody (Ab51502) shows native SATB2 binding at the γ-globin gene promoter in K562 cells. (**, p < 0.01). D, restriction enzyme assay to show proportion of G/Aγ-globin promoters in the SATB2 ChIP samples before and after immunoprecipitation. The result indicates relative enrichment of the Gγ promoter after immunoprecipitation. The PCR product amplified from the Gγ promoter was digested by MseI into 225-bp and 44-bp bands, whereas that of the Aγ promoter formed an uncut 265-bp band in the assay. Bottom: MAR- G/Aγ-pro sequence across the MseI site. E and F, EMSA analysis of in vitro SATB2 binding at MAR-G/Aγ-pro. The biotinylated DNA probes derived from MAR-G/Aγ-pro were incubated with purified GST-SATB2 in the absence or presence of unlabeled competitors, with GST as a negative control. E, competitors were serially mutated MAR-Gγ-pro with underlined bases changed to CCGGCC or (F) wild-type and mutated MAR-A/Gγ-pro corresponding to mut6 of MAR-Gγ-pro. The arrows indicate the band shift position of the SATB2-MAR complex. G, luciferase reporter analysis of the SATB2 regulatory effect on transcriptional activities of wild-type and mutated G/Aγ- promoters in 293T cells. Each error bar represents a standard deviation calculated from experiments performed in triplicate. Student's t test was used for statistical analysis, and p values are indicated (**, p < 0.01).

