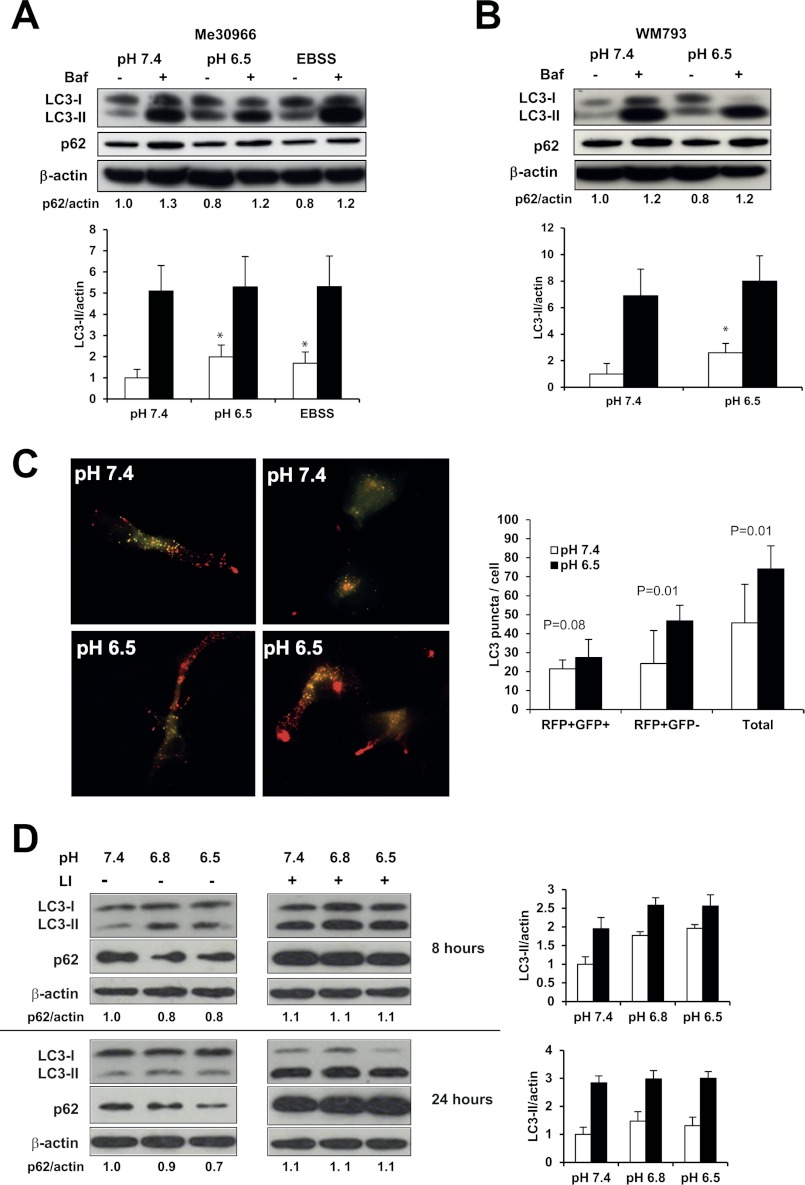
FIGURE 3.
Autophagic flux in melanoma cells under acidic stress. A, analysis of autophagic flux in Me30966 (A) and WM793 (B) cells was performed by evaluating the expression levels of LC3 and p62 in cells cultured in the specified pH conditions in the presence or absence of Bafilomycin A1 (30 nm) for 8 h. C, the presence of autophagosomes and autolysosomes was analyzed in Me30966 cells transfected with GFP-RFP-LC3 plasmid and observed after 8 h incubation with medium at pH 7.4 or 6.5. D, the autophagic flux was analyzed in Me30966 cells after short-term (8 h) and long-term (24 h) exposure to acidic stress in presence or absence of lysosomal inhibitors. Similar results were observed in 2 to 4 independent experiments. Where shown, * indicates p < 0.05.

