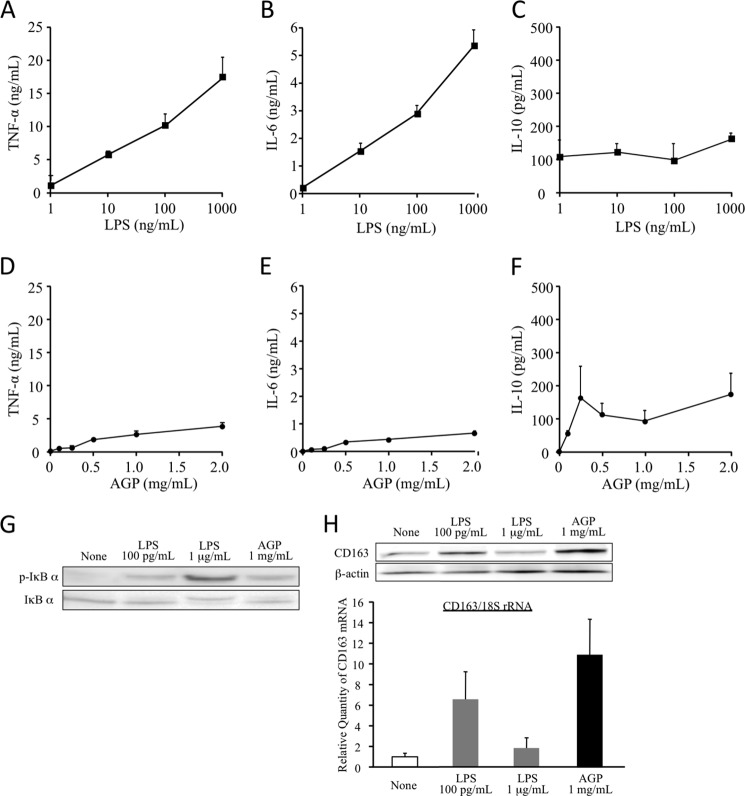
FIGURE 6.
Comparison of cytokine production between AGP and LPS. dTHP-1 cells were treated LPS (A–C) or AGP (D--F) at each indicated concentration for 24 h (A–G) or 2 h (H). Cultured medium was collected and centrifuged. The production of TNF-α (A and D), IL-6 (B and E), and IL-10 (C and F) in supernatants was determined by ELISA. Results are the means ± S.D. of six separate experiments. Cells were lysed in RIPA buffer or RNAiso PLUS. The phosphorylation and degradation of IκB-α were evaluated by Western blotting (G). The expressions of CD163 mRNA and protein were analyzed by quantitative RT-PCR (H, lower panel) or Western blotting (H, upper panel).

