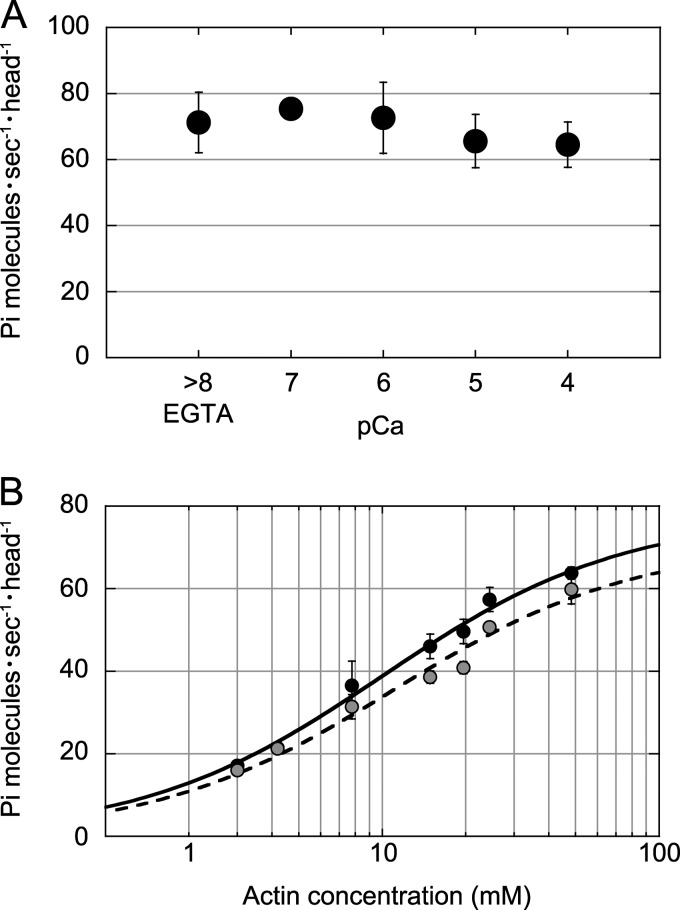
FIGURE 2.
Effects of Ca2+ on ATPase activity of myosin XI. A, actin-activated ATPase activity in the presence of 24 μm F-actin and 1 mm ATP at various Ca2+ concentrations. B, dependence of the actin-activated ATPase rate upon F-actin concentration in the presence of 1 mm ATP in EGTA (black circles) and at pCa 4 (gray circles). The curves are Michaelis-Menten-fitted. The maximum rate in the presence of 1 mm EGTA was Vmax = 77.7 ± 3.1 s−1 head−1 and Kapp = 10.0 ± 1.1 μm, and that at pCa 4 was Vmax = 70.9 ± 4.8 s−1 head−1 and Kapp = 11.0 ± 2.0 μm. All measurements were performed in the assay buffer used for the in vitro motility assay in the presence of 1 mm ATP at 20 °C.

