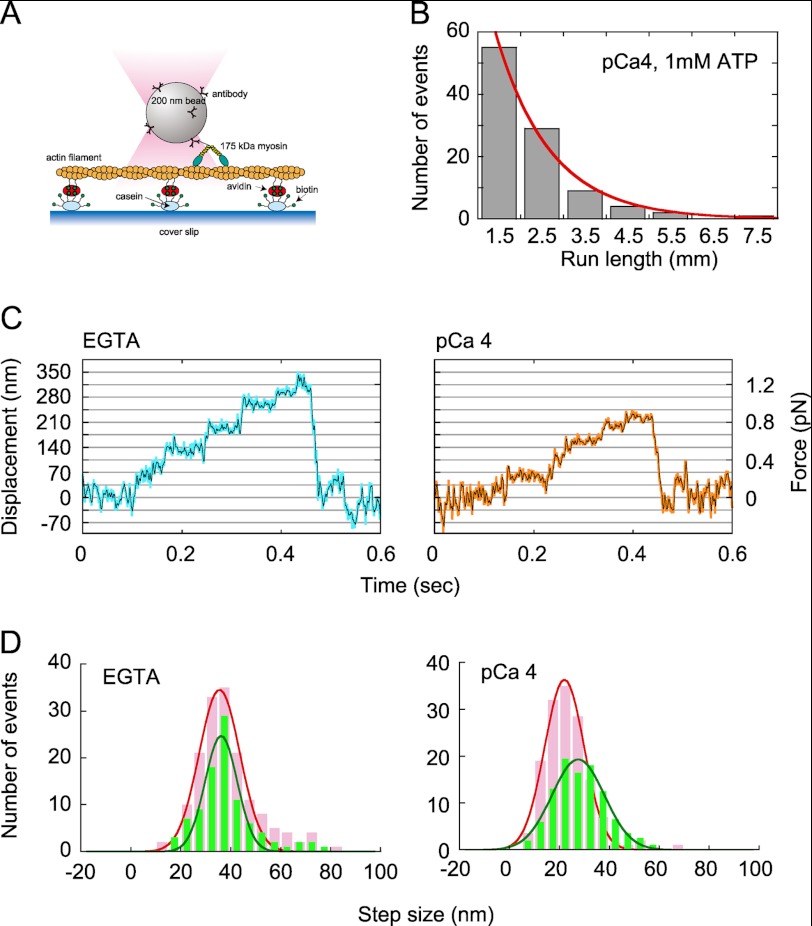
FIGURE 4.
Single-molecule analysis. A, schematic of the experimental arrangement. Partially biotinylated actin filaments (biotinylated actin/non-biotinylated actin = 1:100) were attached to biotinylated casein-coated glass surfaces via avidin. B, run length measured after trapping off. C, force and movement generated by myosin XI on an actin filament in EGTA (left panel) and at pCa 4 (right panel) at 1 mm ATP. Blue and orange lines, raw data; black lines, same data passed though a low-pass filter of 100-Hz bandwidth. D, step size distribution under low-load (<0.5 pN; green bars) and high-load (0.5–1 pN; pink bars) regimes. The curve is a normal distribution fitted to the data with peaks at 36.1 ± 0.5 nm (<0.5 pN) and 35.5 ± 0.4 nm (0.5–1 pN) in EGTA and 27.5 ± 0.4 nm (<0.5 pN) and 22.1 ± 0.2 nm (0.5–1 pN) at pCa 4.

