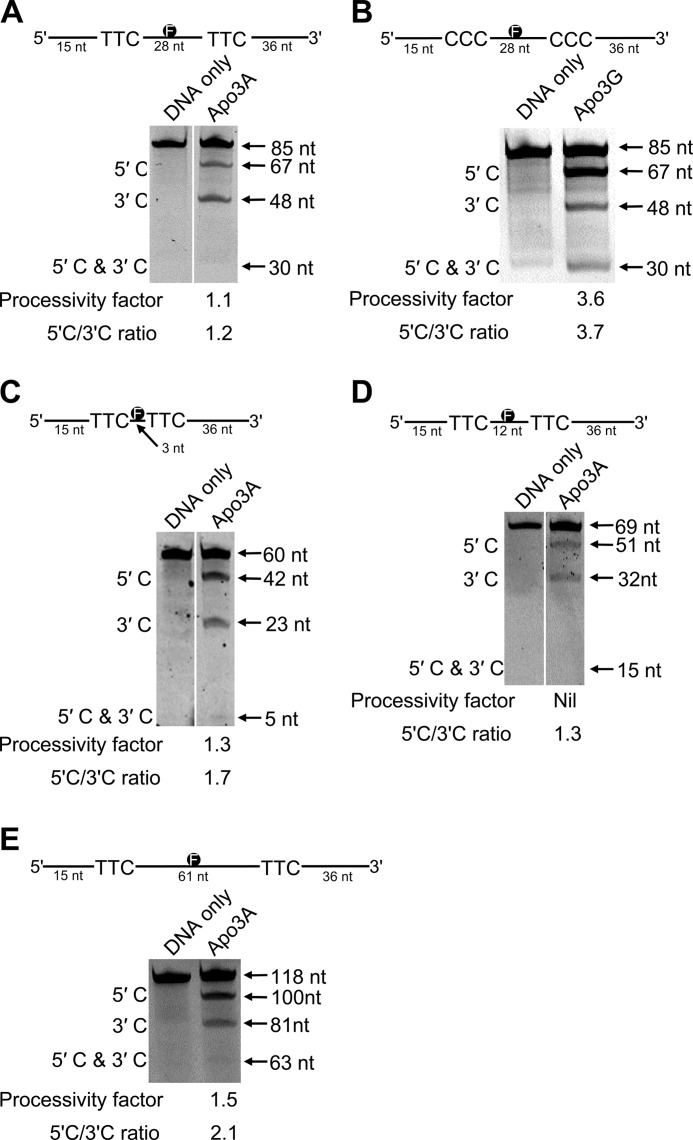
FIGURE 1.
Analysis of Apo3A processivity on ssDNA. A and B, shown is deamination of an 85-nt F-labeled ssDNA substrate by Apo3A (A) and Apo3G (B). Two 5′-TTC (A) or two 5′-CCC (B) motifs are embedded within the ssDNA sequence spaced 28 nt apart. Single deaminations of the 5′-C and 3′-C were detected as the appearance of labeled 67- and 48-nt fragments, respectively; double deamination of both C residues on the same molecule resulted in a 30-nt labeled fragment (5′-C & 3′-C). C, shown is deamination of a 60-nt F-labeled ssDNA substrate by Apo3A. Two 5′-TTC motifs are embedded within the ssDNA sequence spaced 3 nt apart. Single deaminations of the 5′-C and 3′-C were detected as the appearance of labeled 42- and 23-nt fragments, respectively; double deamination of both C residues on the same molecule resulted in a 5-nt labeled fragment (5′-C & 3′-C). D, deamination of a 69-nt F-labeled ssDNA substrate by Apo3A is shown. Two 5′-TTC motifs are embedded within the ssDNA sequence spaced 12-nt apart. Single deaminations of the 5′-C and 3′-C were detected as the appearance of labeled 51- and 32-nt fragments, respectively; double deamination of both C residues on the same molecule resulted in a 15-nt labeled fragment (5′-C & 3′-C). E, deamination of a 118-nt F-labeled ssDNA substrate by Apo3A is shown. Two 5′-TTC motifs are embedded within the ssDNA sequence spaced 61 nt apart. Single deaminations of the 5′-C and 3′-C were detected as the appearance of labeled 100- and 81-nt fragments, respectively; double deamination of both C residues on the same molecule resulted in a 63-nt labeled fragment (5′-C & 3′-C). The measurements of processivity (processivity factor) and polarity (5′-C/3′-C ratio) are shown below the gel. A zero processivity factor means that no band could be detected during analysis. The expected size of the 5′-C & 3′-C band was determined using an identical substrate that had been deaminated to near completion. Values are an average from at least two independent experiments, and the S.E. for the processivity factors are 0.25 (A), 0.09 (B), 0.46 (C), and 0.57 (E).

