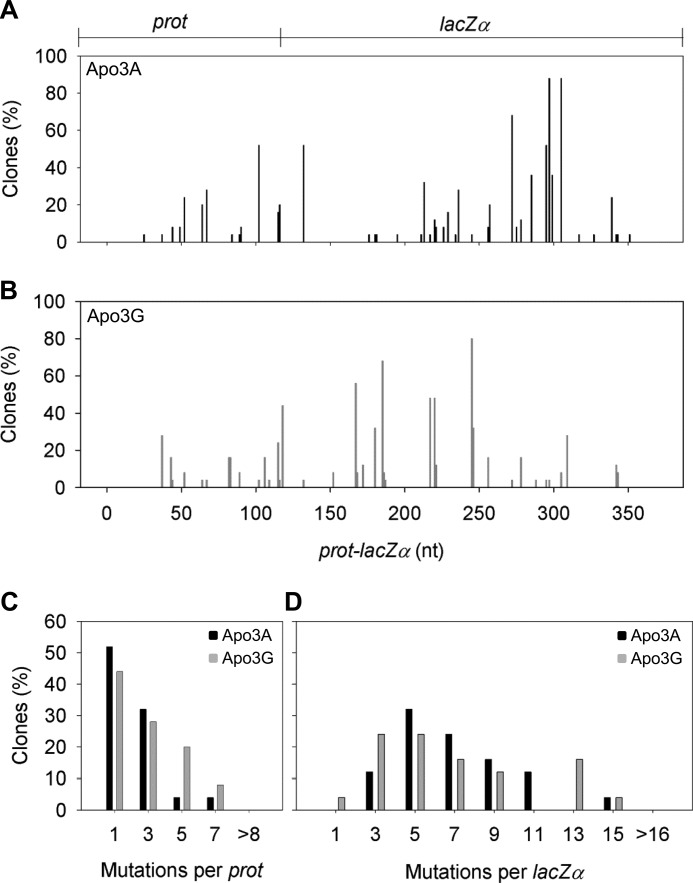
FIGURE 4.
Apo3A- and Apo3G-induced mutational spectra. A and B, shown are spectra of G → A mutations resulting from Apo3A (A)- or Apo3G (B)-catalyzed deaminations occurring during reverse transcription by HIV-1 reverse transcriptase. The DNA substrate formed contains 120 nt of the HIV-1 protease (prot) gene (nt 2282–2401) and 248 nt of the lacZα reporter sequence. Data are represented as the percentage of clones with mutations at a particular site. The x axis denotes the position of the mutation in the construct. C and D, histograms illustrate the per clone numbers of G → A mutations that can be obtained in the prot (C) or lacZα (D) induced by Apo3A (black square) or Apo3G (gray square) deaminations. Values were binned for analysis, and the maximum bin value is shown on the x axis.

