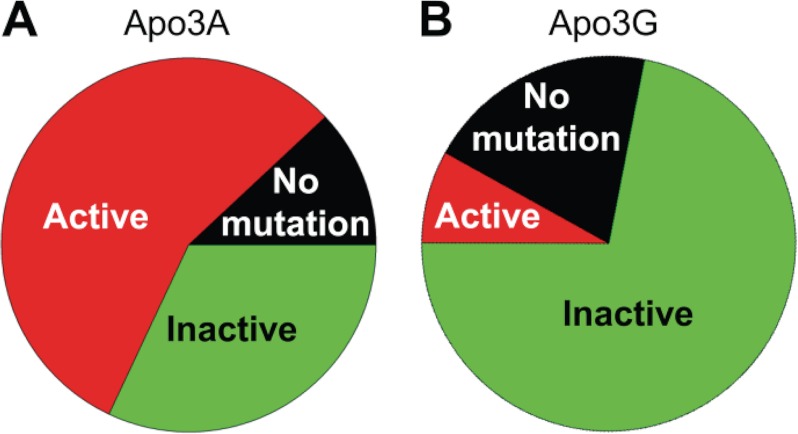
FIGURE 5.
Amino acid changes in the protease resulting from Apo3A- and Apo3G-catalyzed deaminations. Each prot region sequenced was analyzed individually to determine whether deaminations catalyzed by Apo3A (A) or Apo3G (B) were able to induce mutations that led to prot inactivation (Inactive), no inactivation (Active), or no mutations. A, Apo3A was able to inactivate the prot in only 32% of clones and left an active prot (56%) in the majority of clones. Apo3A did not induce any mutations in the prot in 12% of clones. B, Apo3G was effective in inactivating the prot (72% inactive; 8% active) if it catalyzed deaminations in this region. However, there were no mutations in the prot region in 20% of clones.

