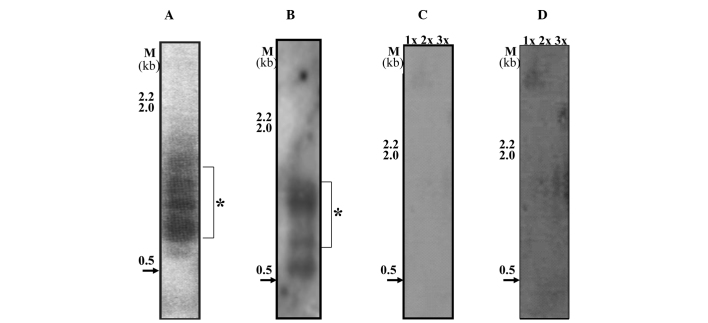
Figure 4.
(A) MCF10CA1− identification of t-stumps in early passage cells when compared to the cells analyzed in Fig 3C. (B) MCF10CA1− t-stumps identified in the later passage of cells when compared to the cells analyzed in Fig 3C. *The position of the distinct cluster. (C) MCF-7; (D) MCF-7 long exposure of phosphorimaging. HindIII-digested LDNA was used as a marker (M).

