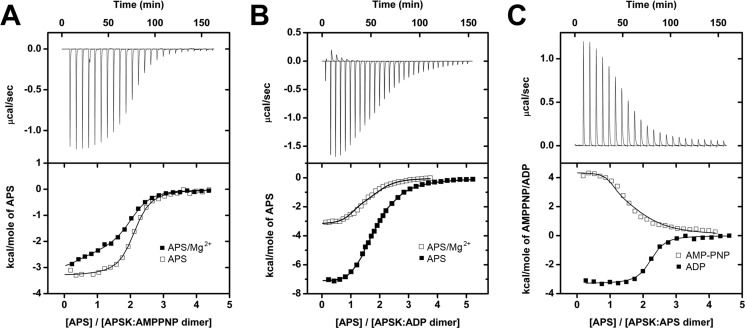
FIGURE 3.
ITC analysis of nucleotide binding to AtAPSK·nucleotide complexes. A, titration of AtAPSK·AMP-PNP with APS (open squares) and APS + 5 mm Mg2+ (solid squares). B, titration of AtAPSK·ADP with APS (solid squares) and APS + 5 mm Mg2+ (open squares). C, titration of AtAPSK·APS with AMP-PNP (open squares) and ADP (solid squares). Representative experimental data for the APS (A and B) and AMP-PNP (C) titrations are plotted as heat signal (μcal s−1) versus time (min) in each upper panel. Each experiment consisted of 20 to 30 injections of 10 μl each of nucleotide into a solution containing AtAPSK dimer and either 0 or 5 mm Mg2+. Each lower panel shows the integrated heat responses per injection. The solid line is the linear regression fit using either a one- or two-site binding model (see Table 3).

