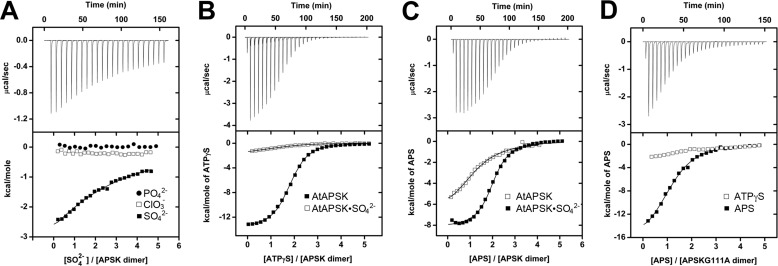
FIGURE 4.
ITC analysis of oxyanion binding to AtAPSK and nucleotide binding to the AtAPSK·SO42− complex. A, titration of AtAPSK with SO42− (closed squares), ClO3− (open squares), and PO42− (closed circles). B, titration of AtAPSK (closed squares) and AtAPSK·SO42− (open squares) with ATPγS. C, titration of AtAPSK (open squares) and AtAPSK·SO42− (closed squares) with APS. D, titration of AtAPSK G111A with ATPγS (open squares) and APS (closed squares). Titrations of the G113A mutant yielded similar results. Representative experimental data for the SO42− (A), AtAPSK/ATPγS (B), AtAPSK·SO42−/APS (C), and G111A/APS (D) titrations are plotted as heat signal (μcal s−1) versus time (min) in each upper panel. Each experiment consisted of 20 to 30 injections of 10 μl each of nucleotide or oxyanion into a solution containing protein. Each lower panel shows the integrated heat responses per injection. The solid line is the linear regression fit using either a one- or two-site binding model (see Table 4).

