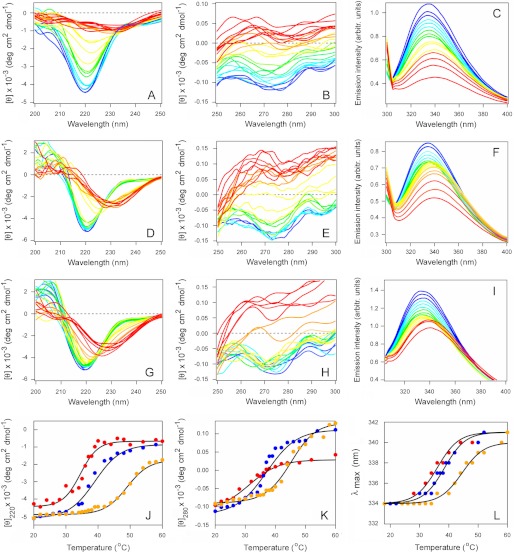
FIGURE 2.
CTA1 is stabilized by its interaction with plasma membrane and lipid raft LUVs. The temperature-induced unfolding of CTA1 (A–C), CTA1 in the presence of plasma membrane LUVs (D–F), and CTA1 in the presence of lipid raft LUVs (G–I) was recorded by far-UV CD (A, D, and G), near-UV CD (B, E, and H), and fluorescence spectroscopy (C, F, and I). The change in color from blue to red denotes the increase in temperature from 20 °C to 60 °C. J–L, thermal unfolding profiles for CTA1 (red), CTA1 in the presence of plasma membrane LUVs (blue), and CTA1 in the presence of lipid raft LUVs (orange) were derived from the data presented in A–I. J, for far-UV CD analysis, the mean residue molar ellipticities at 220 nm ([θ]220) were plotted as a function of temperature. K, for near-UV CD analysis, the mean residue molar ellipticities at 280 nm ([θ]280) were plotted as a function of temperature. L, for fluorescence spectroscopy, the maximum emission wavelength (λmax) was plotted as a function of temperature. One of two independent experiments is shown for each condition.

