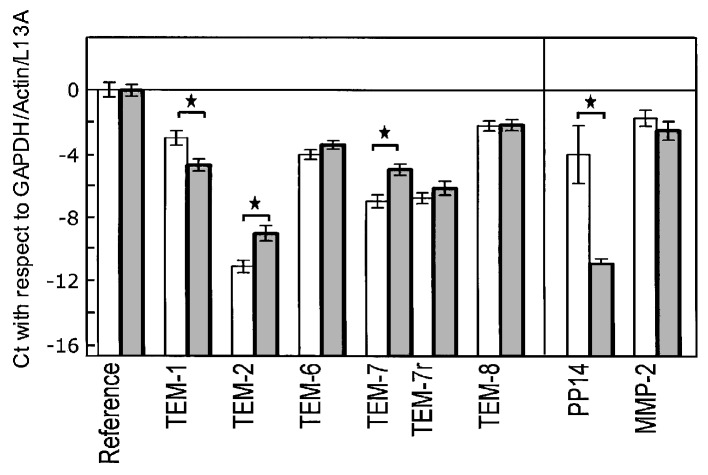
Figure 1.
Gene expression levels of tumour endothelial markers (TEMs), glycodelin (PP14) and matrix metalloproteinase-2 (MMP-2) in healthy endometrial tissue (light bars, n=8) and endometrial carcinoma (dark bars, n=10). Values are expressed as mean ± SD in Ct (i.e., relative to the copy number, in powers of 2) and normalised to the means for GAPDH, β-actin and ribosomal protein L13A (reference genes). The base line (-16.7) corresponds to the absence of the QPCR signal for the reference genes after 40 cycles. *Statistically significant differences (P<0.05, Student’s t-test).

