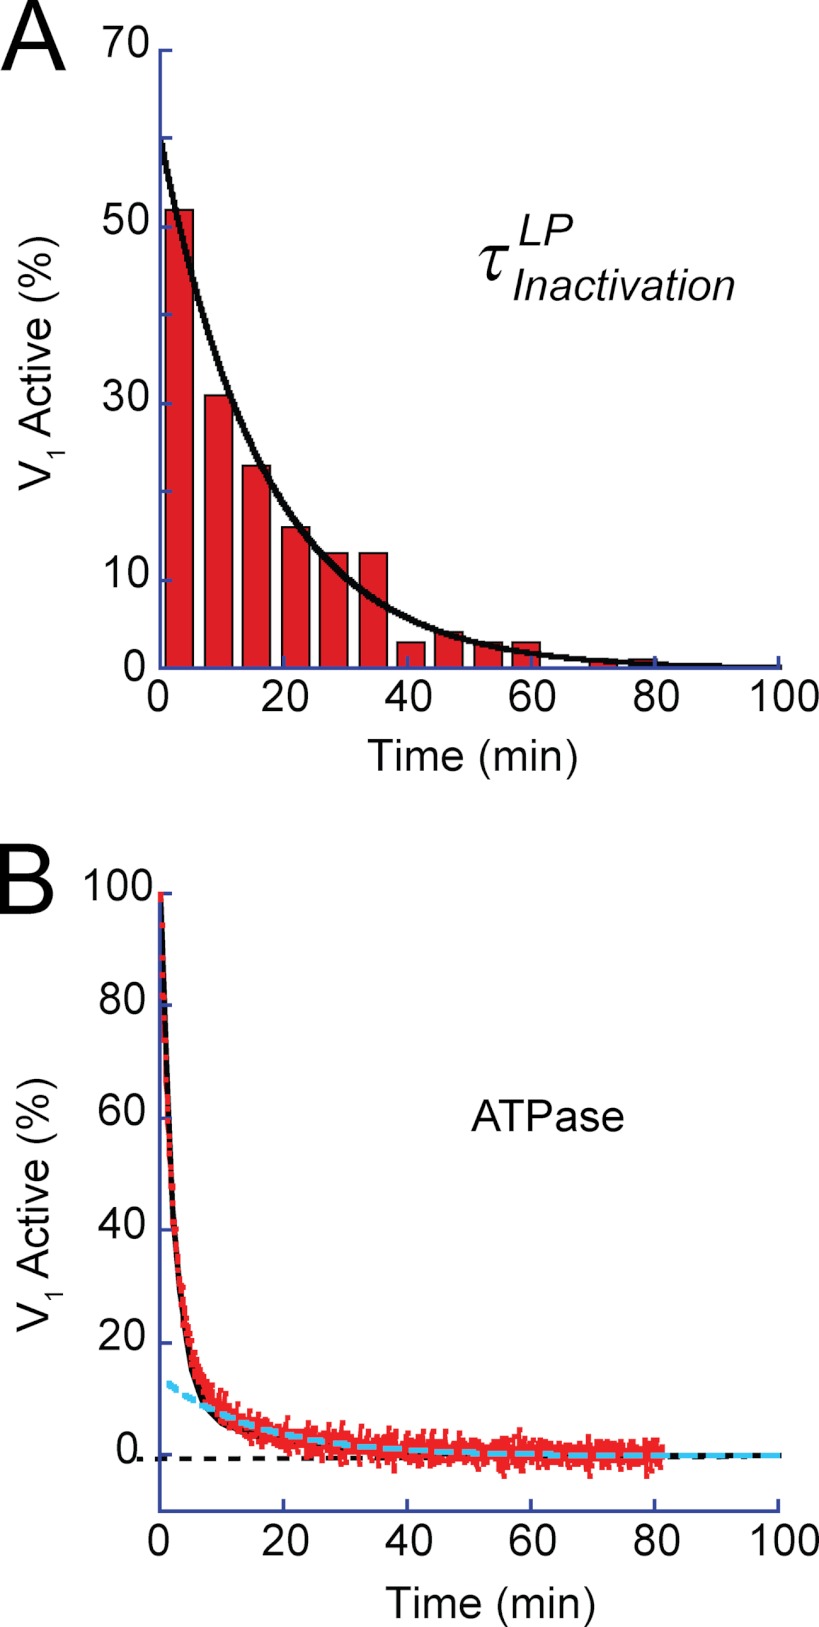
FIGURE 7.
Kinetic analysis of LP and inactivation in ATPase assay. A, dwell time histogram of rotation time until lapsing into the LP state. The rotation time includes the SPs. Single exponential fitting gave a time constant of 17.6 ± 1.5 min. B, time course of spontaneous inactivation observed in bulk ATPase assay. Activity was monitored with an ATP-regenerating system. The inactivation proceeded in two phases as follows: a fast phase (τfast = 2.13 min) and a slow phase (τslow = 15.7 min). Black and dotted cyan lines represent the fractions of the fast and slow phases.

