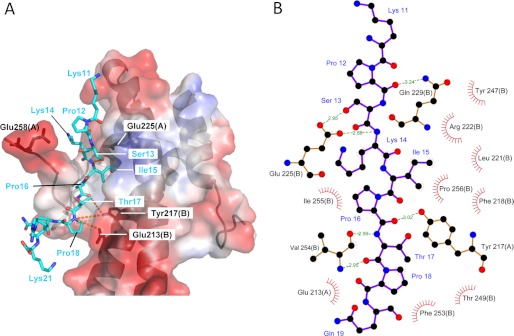
FIGURE 1.
X-ray crystal structure of the EB1c-MACFp1 complex. A, representation of the complex between MACFp1 (cyan sticks) and EB1c (transparent surface and schematic representation). The transparent surface of EB1c is color-coded with its electrostatic potential (from −69.74 to 69.74 KbT; red and blue depict negative and positive electrostatic potentials, respectively). Hydrogen bonds are represented with dashed orange lines. The crystal structure of the EB1c-MACFp1 (Protein Data Bank entry 3GJO) complex has been relaxed by running a 1-ns molecular dynamics simulation. The figure was prepared using PyMOL (Schrödinger, LLC). B, schematic diagram of the EB1c-MACFp1 complex. Hydrogen bonds are indicated by dashed lines between atoms, including their distance in Å. Residue labels are shown in black for EB1 and blue for MACFp1. Hydrophobic contacts are represented by arcs with spokes radiating toward the ligand atoms, which are shown with spokes radiating back. The figure has been generated using LIGPLOT (48). The chain identifiers are shown in parentheses for EB1 residue labels.

