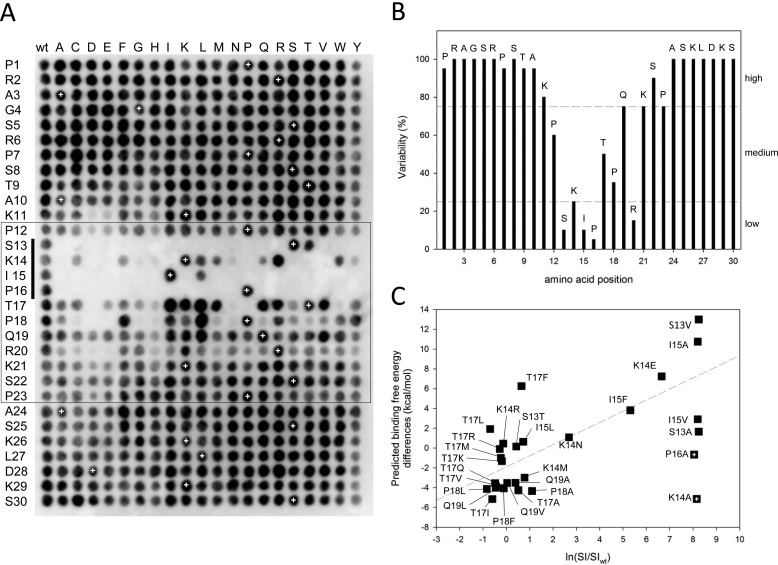
FIGURE 2.
Sequence profiling of a canonical MtLS. A, complete single-point substitution analysis of the peptide MACFp1. Black spots indicate interactions between EB1 and membrane-bound MACFp1 variants. Each spot corresponds to a variant in which one residue of the MACFp1 sequence (given on the left) was replaced by one of the 20 gene-encoded amino acids (shown at the top). Spot SI values were determined by densitometry. The spots in the first column and the ones marked by white crosses represent replicas of the wild type MACFp1 sequence and were used to define the threshold between binding and non-binding (binding spot: SI ≥ ½(mean SI of wild type spots)). The box highlights the sequence 12PSKIPTPQRKSP23, which is the region of MACFp1 most sensitive to substitutions. The SKIP motif (i.e. which corresponds to the SXIP motif of MACFp1) is indicated by a vertical bar on the left. B, percentage of replacement variability (V) at each position of the MACFp1 sequence. The V value was calculated as V = (number of binding spots/20) × 100 and plotted against the MACFp1 sequence. The dashed lines divide sequence regions into low (V ≤ 25%), medium (75% ≥ V ≥ 25%), and high residue variability (V ≥ 75%). C, correlation between the SPOT signal (ln(SI/SIWT) and the predicted binding free energy differences. The dashed line represents the lineal regression of the different data points. The two crossed squares (P16A and K14A) indicate outliers for which the predictions failed.

