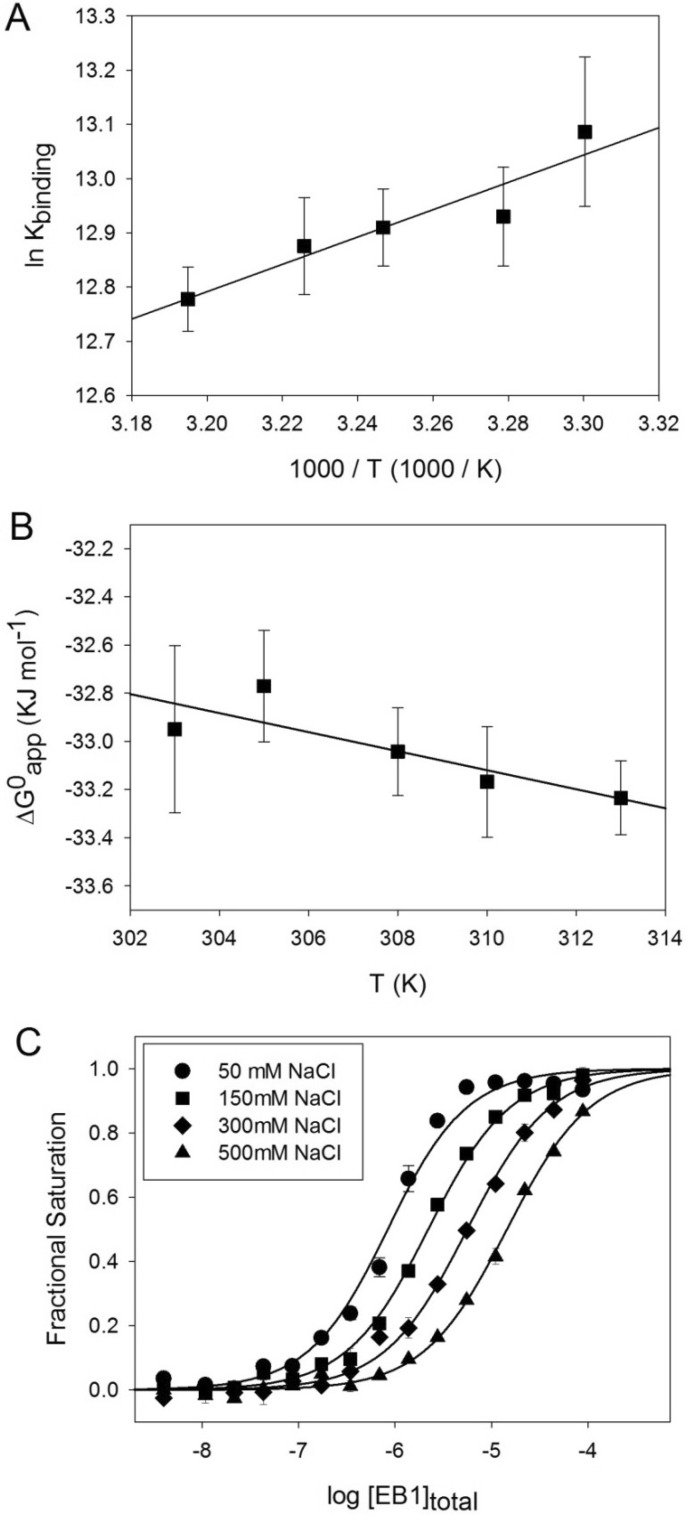
FIGURE 4.
Thermodynamic characterization of the EB1-MACFp1 interaction. A and B, Van't Hoff (A) and Gibb's (B) plots of the EB1-MACFp1 interaction. The binding constants were determined by FP measurements at different temperatures. Shown are the experimental data points with S.D. values (error bars) and the linear regressions used to derive ΔHapp, following the van't Hoff equation, ln Kb = −ΔH/RT + ΔS/R, and ΔSapp, following the Gibbs equation, ΔG = ΔH − TΔS. C, binding isotherms obtained at 30 °C for the EB1-MACFp1 interaction in the presence of different NaCl concentrations: 50 mm (circles), 150 mm (squares), 300 mm (diamonds), and 500 mm (triangles). Symbols represent the measured fractional saturation values calculated from the FP data using Equation 1. Error bars, S.E. values; solid lines, best fit to the data according to a simple ligand binding model described by Equation 2 (see “Experimental Procedures”).

